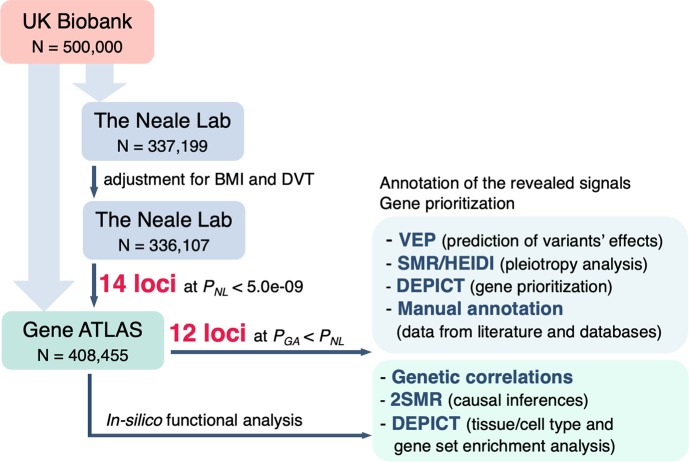
Fig 1. Scheme depicting the overall workflow of our study.
GWAS summary statistics for VVs was obtained from the Gene ATLAS (larger sample size, less stringent filtering criteria) and the Neale Lab database (smaller sample size, more stringent filtering criteria). Search for associated loci was performed using the Neale Lab data adjusted for two potential confounders–body mass index (BMI) and deep venous thrombosis (DVT). GWAS summary statistics for these two traits were also obtained from the Neale Lab database. Since our study design did not imply a replication stage, genome-wide significance threshold was set at 5.0e-09. To be more rigorous, we filtered out those loci for which P-values in the Gene ATLAS dataset were higher than the corresponding P-values in the Neale Lab dataset (after all corrections). For the resulting 12 loci, we performed a functional annotation analysis and prioritized the most likely causal genes. Except for VEP, all in-silico analyses were conducted using the Gene ATLAS dataset since it enables to achieve the highest statistical power and is genetically equivalent to other studied VVs datasets (genetic correlation coefficient = 0.99–1.00, S1 Table).

