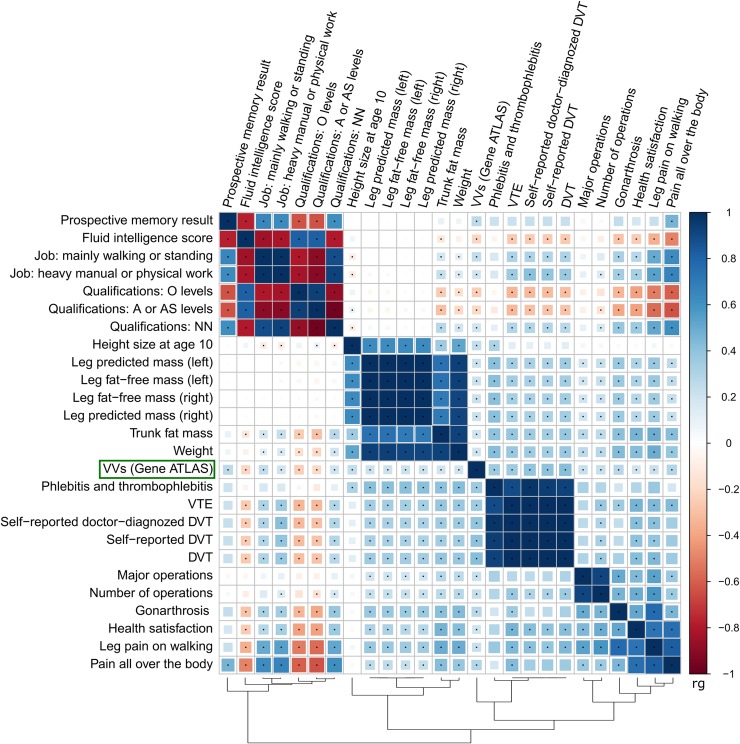
Fig 4. Matrix of genetic correlations between VVs and other complex traits.
Color depicts the sign and the absolute value of genetic correlation coefficient (rg). Only the traits having |rg| ≥ 0.2 with VVs are shown. Combinations with statistically significant rg are marked with points (P < 3.1e-05). O levels of qualification correspond to the General Certificate of Education Ordinary Level/the General Certificate of Secondary Education; A or AS level correspond to Advanced or Advanced Subsidiary levels. “Qualifications: NN” means no qualification. Full names of traits as indicated in the Neale lab and the Gene ATLAS databases are given in S15 Table. For “Prospective memory result” and “Health satisfaction”, high scores correspond to poor performance. DVT, deep venous thrombosis; VTE, venous thromboembolism.

