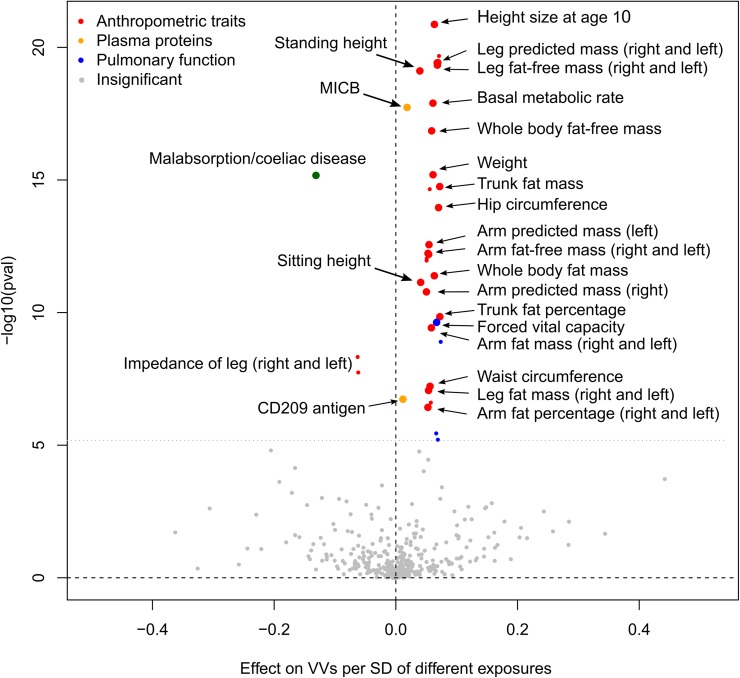
Fig 5. Volcano plot depicting the results of hypothesis-free 2SMR analysis (IVW approach).
The x-axis shows 2SMR beta, and the y-axis denotes the level of statistical significance on a logarithmic scale. Grey color indicates the traits that did not pass either 2SMR, or the Steiger test, or additional robustness analysis. Small colored circles depict the traits that passed these tests, but either exhibited heterogeneity in causal effects amongst instruments after removing potential outlier SNPs or did not passed 2SMR after this procedure. Large colored circles represent the traits that both passed 2SMR and showed no heterogeneity after the outliers removal (“the most reliable traits”). 2SMR coefficients are shown as calculated before the correction for pleiotropy. “Pulmonary function” traits include different estimates of forced vital capacity and forced expiratory volume in 1-second. Further details are provided in S13 Table. MICB, MHC class I polypeptide-related sequence B.

