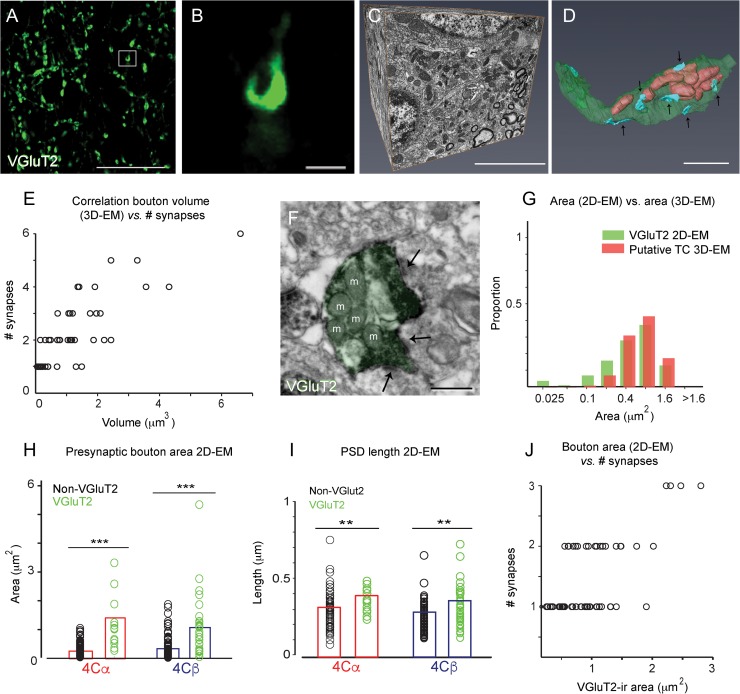
Figure 1.
The experimental approach used to estimate the number of TC synapses from confocal bouton volume. (A) Confocal image showing VGluT2 immunolabeling in layer 4Cβ. (B) Higher magnification of the bouton outlined by the white square in A showing the horseshoe shape that matches the distribution of vesicles in F. (C) Example 3D-EM block, obtained using the FIB/SEM, from a separate sample of tissue than that shown in A, B. (D) 3D reconstruction of a large single bouton in layer 4Cβ with multiple asymmetric synapses (blue, arrows). Mitochondria are observed inside the terminal, appearing as tubular shapes pseudocolored light red within the transparent axon terminal. (E) Positive correlation between bouton volume (excluding the volume occupied by mitochondria) and the number of synapses established by each bouton, determined from 3D reconstruction of 64 boutons in layer 4Cβ from serial EM images (Number synapses = 1.01*Volume + 1.18; r = 0.80). (F) Electron micrograph of a VGluT2-ir bouton (pseudocolored with green) establishing multiple asymmetric synapses (arrows). Mitochondria marked with m. (G) Overlapping distributions of areas of single VGluT2-ir boutons acquired with TEM (green) and areas of cross-sections of “putative TC terminals” selected by their size from 3D-EM blocks (red). (H) Presynaptic areas (bouton areas) of VGluT2-ir (green) and non-VGluT2-ir (black) terminals in both 4Cα and 4Cβ. Difference in area was significant in both 4Cα (P < 0.001) and 4Cβ (P < 0.001), Student’s t-test. (I) PSD lengths established by VGluT2-ir and non-VGluT2-ir terminals in both 4Cα and 4Cβ. PSDs were significantly longer by about 25% for the VGluT2-ir terminals in both 4Cα (P < 0.01) and 4Cβ (P < 0.01), Student’s t-test. (J) Positive correlation between the VGluT2-ir bouton area and the number of synapses measured from 2D-EM single images (Number synapses = 0.74*Area + 0.73; r = 0.66). Data combined from layers 4Cα and 4Cβ. Scale bars: A, 20 μm; B, 1 μm; C, 5 μm; D, 1 μm; F, 500 nm.

