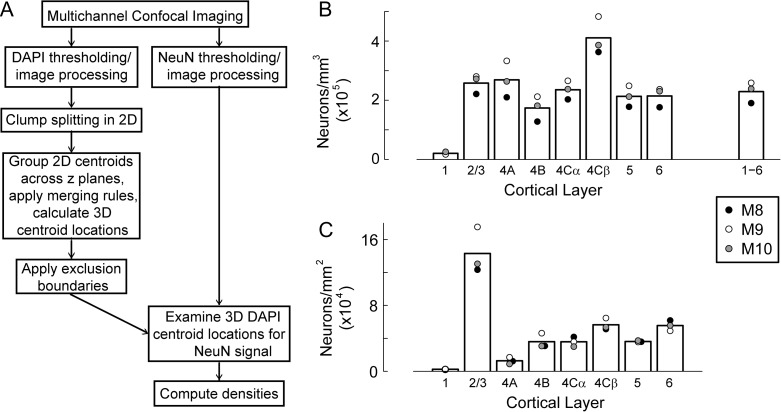
Figure 3.
Distribution of neuronal density across cortical layer. (A) The multichannel confocal imaging and 3D image analysis method for automated segmentation and counting of neurons. Confocal image stacks of DAPI and NeuN stained cell nuclei and neurons were acquired. Cell centroid positions in 3D were determined by segmentation of DAPI images followed by grouping of 2D centroids across image planes. DAPI-stained cells were then classified as neuronal or non-neuronal by evaluating thresholded mask images of the NeuN channel for signal at the locations of 3D DAPI centroids. Large numbers of cells (~32 000) and neurons (~22 000) were reliably counted using these automated procedures to provide densities within each cortical layer. (B) Mean neuronal density within each cortical layer (bars in the histogram), with average values obtained from 3 to 5 image series from each of 3 animals (M8, M9, M10) (filled circles). The average value across all layers is shown by the bar labeled 1–6. (C) The total number of neurons under a 1 mm2 region within each layer, following the same conventions as in B. For visibility, black points for layers 4A, 4B, and 5 have been offset slightly to the right.

