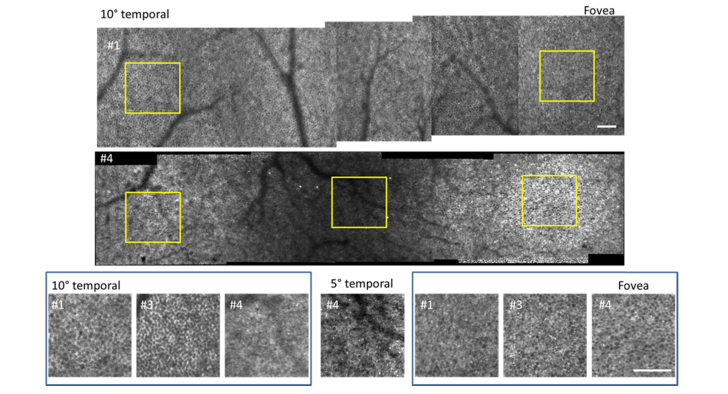
Fig. 3.
Variation in appearance of RPE in healthy volunteers. Top and center row: mosaics from 10° temporal to the fovea in subjects #1 and #4. Note the dimmed ring containing a few hyper AF cells from 3 to 5° in subject #4. Bottom row: zooms on 10° temporal (left box), 5° temporal (center panel) and fovea (right box) of subjects #1, #3 and #4; inset yellow squares in images above denote locations shown for subjects #1 and #4. Contrast and brightness have been altered in the zoomed panel on the 5° temporal location in subject #4 as this region of the retina gave dimmer images than elsewhere. Note the diffuse fluorescence with hyper AF cells in #4 at 10°. Scale bars are 100µm.

