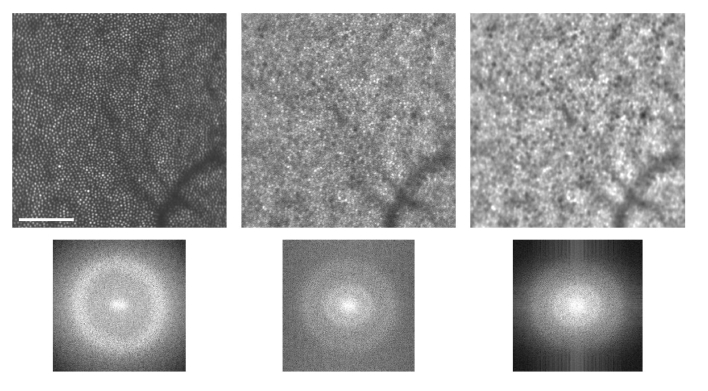
Fig. 4.
The discrete Fourier transform of the reflectance (top left) and NIRAF (top center) images produces Yellott’s rings in the power spectrum corresponding to the modal frequencies of the photoreceptor and RPE spacing (bottom). The NIRAF power spectrum contains peaks in two frequency bands corresponding to that of the photoreceptors (outer ring) and that of the RPE (inner ring). Applying a bandpass filter can suppress the cone signal to enhance visibility of the RPE mosaic (right). Scale bar is 100 µm.

