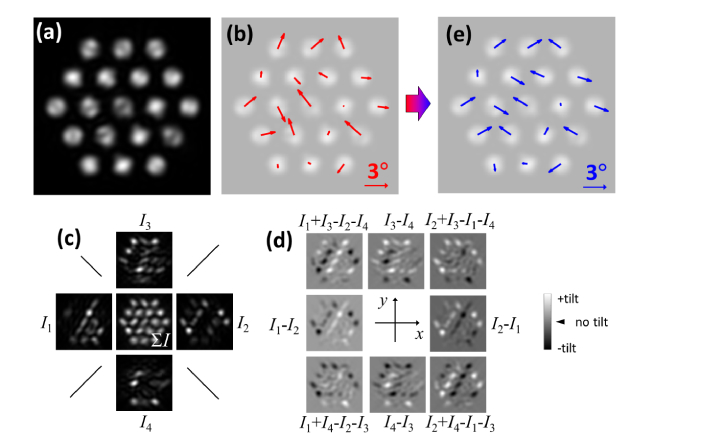
Fig. 2.
Simulated parafoveal cone mosaic imaging and analysis assuming circular reflective scattering layers in the ellipsoid of each photoreceptor. Each reflector is added random tip/tilt with uniform amplitude of up to ± 3°. The resulting intensity image with a full 6.0 mm circular pupil is shown in (a) for a mosaic of 19 cones across a 40 × 40 μm2 area. In (b) red arrows show the random tilts of each simulated cone (vectors overlaying the intensity mage). In (c) quadrant retinal images are shown together with the algebraic image sum. In (d) difference images reveal photoreceptor obliqueness mapped onto a grayscale between maximum + 3° (positive, white) and minimum −3° (negative, black) angles. The same grayscale is used both horizontally (tilt) and vertically (tip). Finally, in (e) the reconstructed obliqueness of each simulated cone is shown (blue arrows) as determined from Eq. (1) using only intensity differences at the central pixels of each reflector.

