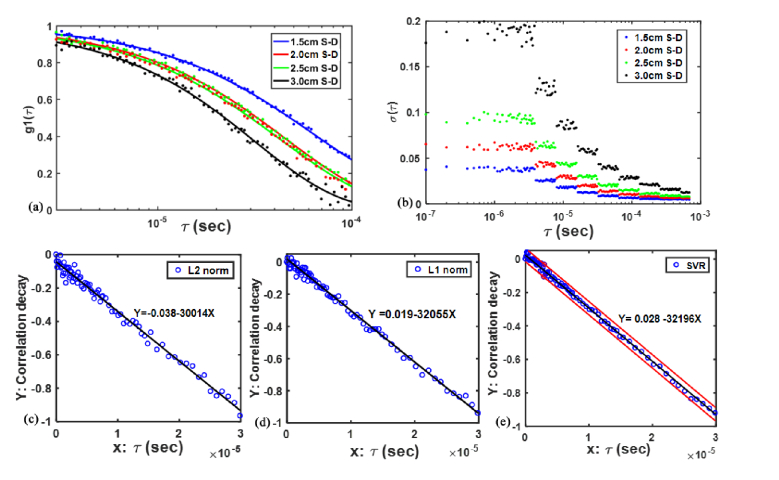
Fig. 3.
Autocorrelation functions g1(τ) with noise generated by the computer simulations at four S-D separations (a), the g1(τ) noise (b), and the fifth-order linear regression lines ((c)-(e)) by L2 norm, L1 norm and SVR, respectively. The two red lines in Fig. 3(e) denote the decision plane in the SVR approach.

