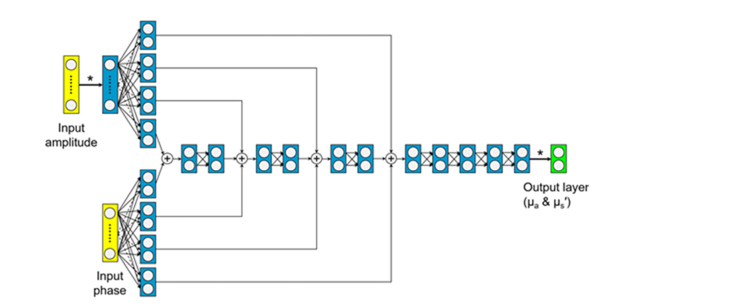
Fig. 2.
Diagram of the structure of the deep neural network used to estimate absorption and scattering from calibrated amplitude and phase. Input nodes are shown in yellow, open circles indicate neurons, solid lines represent connections between layers, and the output layer is shown in green. Asterisks denote scaling of the input amplitude at the beginning and descaling at the end. The structure was chosen to have relatively few free parameters to decrease training time and reduce the likelihood of overfitting.

