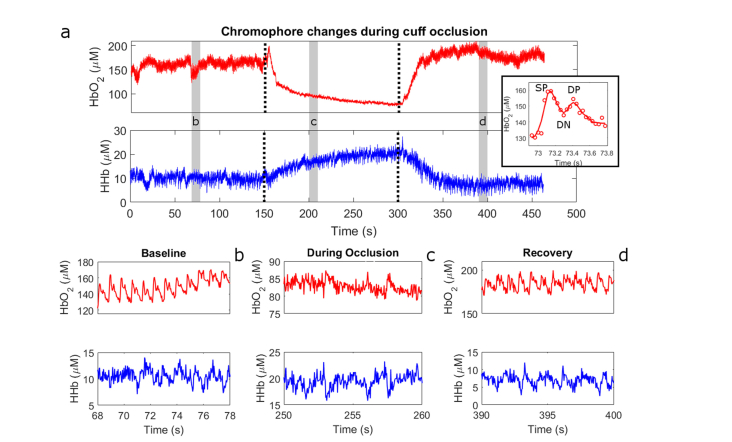
Fig. 5.
(a) Tissue oxyhemoglobin (top) and deoxyhemoglobin (bottom) traces from the thumb of a human subject. Dotted lines indicate the start and end of an arterial occlusion on the upper arm. Gray boxes indicate the regions that are zoomed in in panels (b)-(d). Note the disappearance of the pulsatile signal during the occlusion in panel (c). Inset: Oxyhemoglobin changes over a single pulse. Data points are indicated with circles and the line is a 7-point loess fit to those points. Features of the pulse such as the systolic peak (SP), dicrotic notch (DN), and diastolic peak (DP) are readily appreciated.

