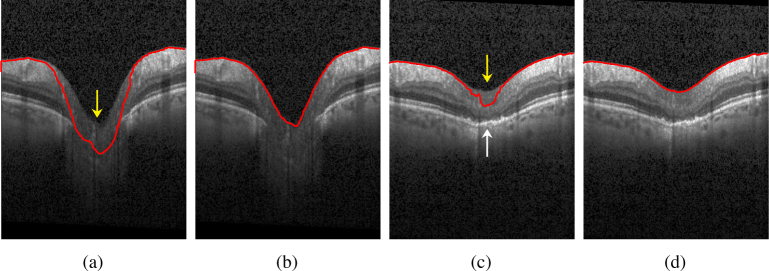
Fig. 3.
a) Example of an ONH region with very low contrast compared to the vitreous (yellow arrow). This leads to the contour leaking into the tissue. b) The same scan with correctly detected ILM after scaling the values for c1 and c2 according to equation 7; c) Example of an ONH region with low intensity values at the inner layers (yellow arrow) compared to the dark vitreous as well as to the hyperintense outer layers (white arrow). This causes the contour to falsely detect parts of the lower layers as vitreous. d) The same scan with correctly detected ILM by rescaling values c1 and c2 after the interface has almost reached the desired ILM contour.

