Fig. 5.

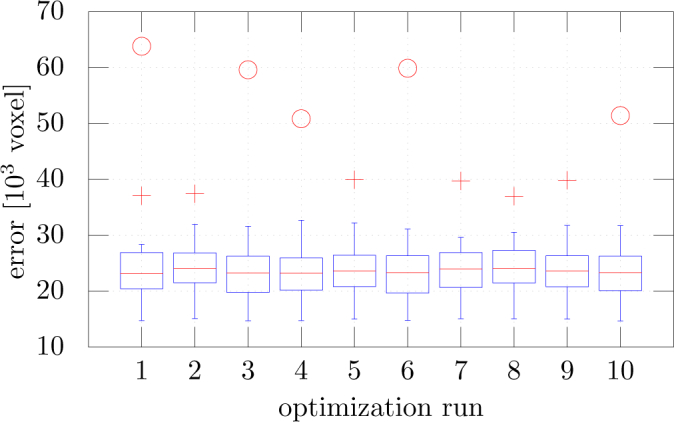
Error distribution over 20 scans represented as box plots for the 10 optimization runs. The + symbol and the ◦ symbol denote outliers with an error deviating more than 1.5 × STD and more than 3.0 × STD from the mean, respectively.

Error distribution over 20 scans represented as box plots for the 10 optimization runs. The + symbol and the ◦ symbol denote outliers with an error deviating more than 1.5 × STD and more than 3.0 × STD from the mean, respectively.