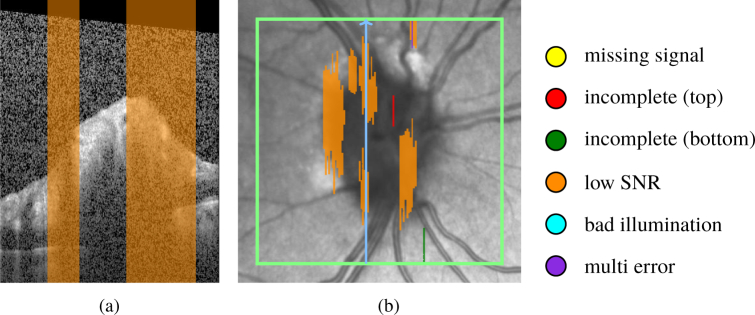
Fig. 8.
Quality assessment of a volume scan: (a) B-scan with low SNR region in orange, (b) corresponding SLO image with quality assessment map, color coded according to the criteria shown at the right hand side of the map; green rectangle delimits the scan area; blue arrow shows the B-scan position.

