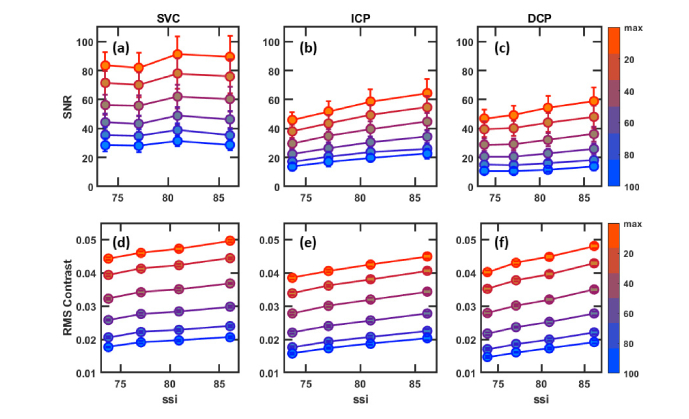
Fig. 7.
Projection by average over different populations of voxels in healthy eyes. Colorbars on the right indicate the percentile of brightest pixels averaged over to form en face projections. Colors run from orange (maximum value projection) through purple (top 40 – 60th percentile of voxels) to blue (all voxels included, which is equivalent to mean projection). (a-c) SNR, (d-f) RMS contrast.

