Fig. 8.
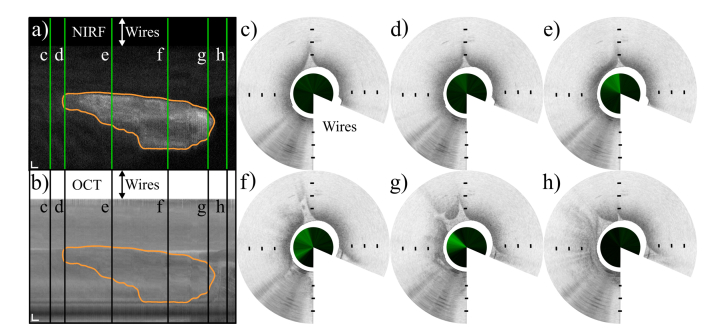
Combined NIRF and OCT endoscopic images of a tumor located in the peritoneal cavity. a) and b) show NIRF and en face OCT images of the tumor, respectively, unwrapped along the circumference of the endoscope. The NIRF greyscale range is [1.1–3.5]∙106 photons/s (i.e. fluorescence background and maximum value). The en face OCT projection was obtained by integrating OCT intensity over a depth of 500 µm starting from the tissue surface. The vertical axis represents the circumference of the endoscope, the horizontal axis represents the pullback direction over a distance of 5 mm, from left to right. Scale bars 200 µm. The tumor is delineated by the orange contour obtained similarly to Fig. (7) and 8. Figs. (c-h) show cross sectional images taken from sequential locations along the pullback, indicated by the vertical green lines in a) and the black lines in b), from left to right. The inner circles show the one-dimensional NIRF data surrounded by the OCT cross sections segmented starting from the endoscope outer sheath. The white wedge of each B-scan masks the area of tissue blocked by the electrical wires. Distance between markers 0.5 mm (Visualization 3 (7.5MB, mp4) ).

