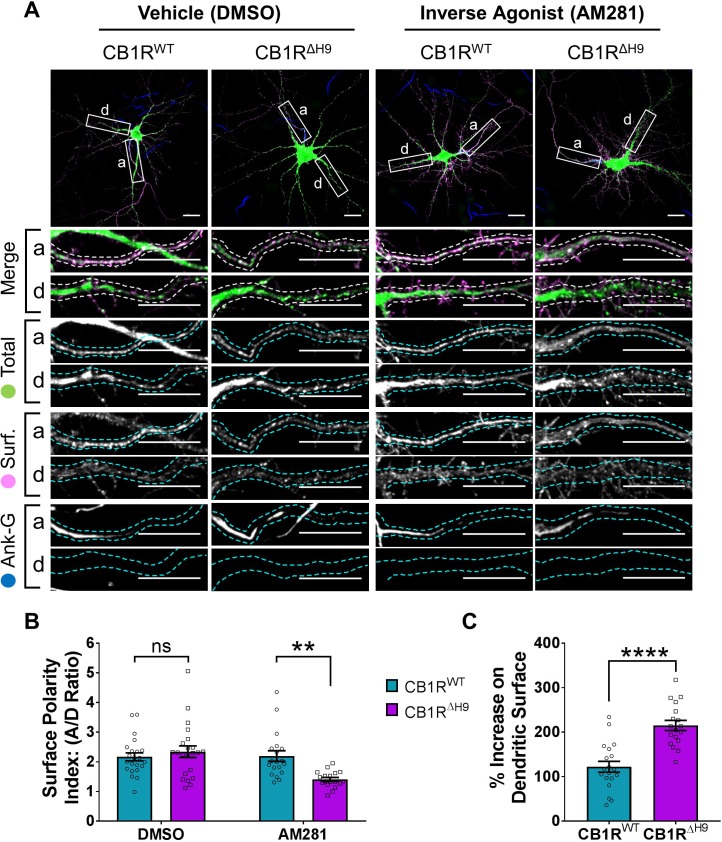
Figure 8. The role of H9 in polarity is revealed in the presence of inverse agonist.
(A) Representative confocal images of DIV 14 hippocampal neurons expressing EGFP-CB1RWT or EGFP-CB1RΔH9 and treated with vehicle (0.2% DMSO) or CB1R inverse agonist (10 µM AM281) for 3 hr. Upper panels for each condition show whole cell field of view and lower panels are enlargements of axonal (a) and dendritic (d) ROIs. Green = total; magenta = surface; blue = axon marker (Ankyrin-G). Merge: surface to total seen as white. (B) Quantification of data shown in (A) presented as the surface polarity index (A/D ratio). In the presence of inverse agonist, but not vehicle, EGFP-CB1RΔH9 was significantly less axonally polarised than EGFP-CB1RWT. Two-way ANOVA with Sidak’s post hoc test. N = three independent experiments; n = 18–22 neurons per condition. DMSO, WT vs. ΔH9: mean ± SEM, 2.17 ± 0.135 vs. 2.34 ± 0.196; N = 3, n = 22 vs. N = 3, n = 22; nsp = 0.9605. AM281, WT vs. ΔH9: mean ± SEM, 2.2 ± 0.18 vs. 1.41 ± 0.0649; N = 3, n = 19 vs. N = 3, n = 18; **p = 0.0067. (C) Quantification of data represented in (A). Significantly more EGFP-CB1RΔH9 than EGFP-CB1RWT relocated to the surface of dendrites after inverse agonist application. The surface mean fluorescence was first normalised to the total mean fluorescence for each ROI, then to the average DMSO value within a condition (set to 100%). Unpaired t-test. N = three independent experiments; n = 18–19 neurons per condition. WT vs. ΔH9: mean ± SEM, 122 ± 12.2 vs. 215 ± 11.3; N = 3, n = 19 vs. N = 3, n = 18; ****p < 0.0001.

