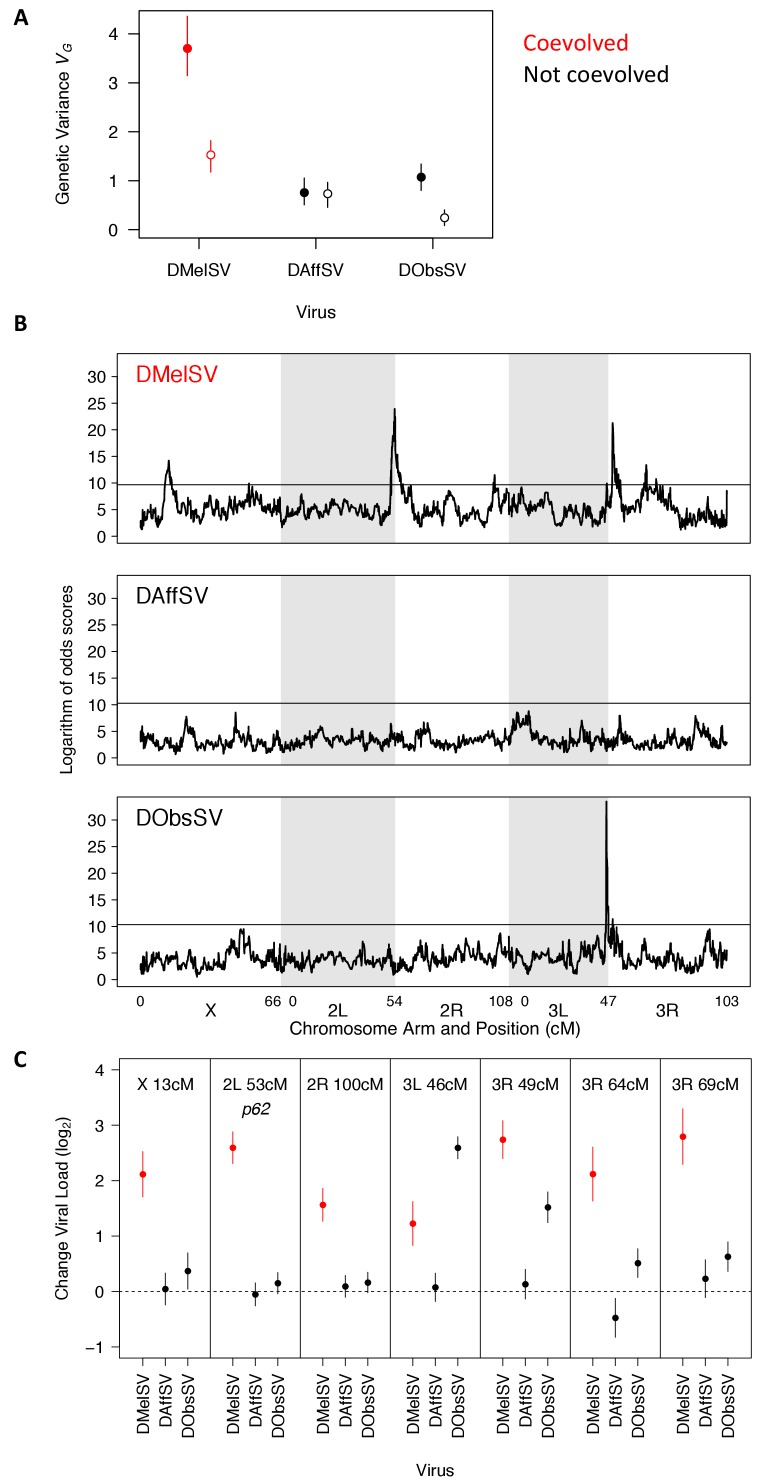
Figure 4. The genetic architecture of resistance to coevolved and non-coevolved viruses in D. melanogaster.
(A) The genetic variance in viral load within the mapping population (filled circles). The open circles are estimates of the genetic variance after accounting for the effects of the QTL in panel C. Error bars are 95% credible intervals. (B) QTL affecting viral load. The horizontal line shows a genome-wide significance threshold of p<0.05 that was obtained by permutation of Logarithm of odds (LOD) scores. (C) The effect of the seven QTL detected on the load of the three viruses. Only QTL that remained were significant following multiple regression with all the loci are shown. The coevolved virus is shown in red.

