. 2019 Apr 30;8:e44433. doi: 10.7554/eLife.44433

Figure 3. Evolutionary modeling.

Best fitting evolutionary models. (A) Best fitting a priori evolutionary hypothesis according to OUCH. (B) Arrangement of selective regimes fit by SURFACE. (C) The first two principal components with phenotypic optima estimated by SURFACE. (D) The first and third principal components with phenotypic optima estimated by SURFACE. Note the tight fit of species means (small dots) around their optima (large dots) as well as the placement of Ar. ramidus near the African ape phenotypic optimum. The colors in C and D correspond to the selective regimes painted onto the phylogeny in B.

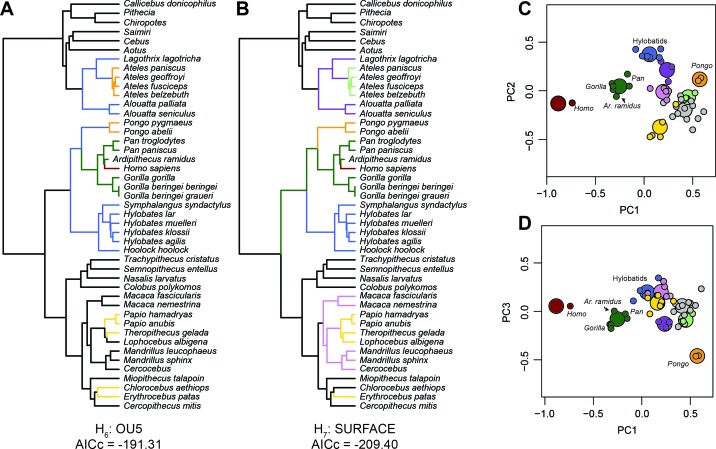
Figure 3.

Figure 3—figure supplement 1. Alternative evolutionary hypotheses represented by painting branches of the phylogeny according to selective regimes.

Figure 3—figure supplement 1.

(A) Regimes correspond to bipedality in humans and terrestrial quadrupedalism in African apes and several cercopithecine taxa. (B) The terrestrial regime is split into terrestrial plantigrady in the African apes and terrestrial semiplantigrady in the cercopithecines. (C) An additional climbing regime is added for gibbons, orangutans, and atelids.
Figure 3—figure supplement 2. Simulation results for a priori evolutionary model comparisons.

Figure 3—figure supplement 2.

The light grey distributions represent the simpler of the two models whereas the dark grey distributions represent likelihood ratio statistics for more complex models. The vertical line represents the actual likelihood ratio statistic measured between the two models. There is statistical power to distinguish between all a priori models, with weakest power for Brownian motion versus OU1.