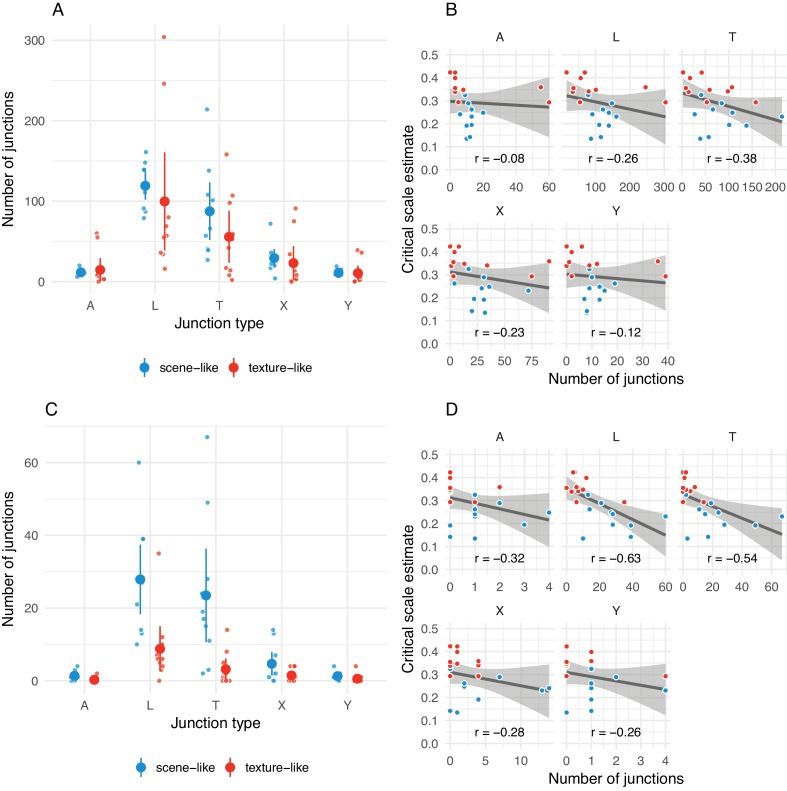
Appendix 1—figure 3. The number of junctions present in original images may be related to critical scale estimates.
(A) Distribution of arrow (A), L-, T-, X- and Y-junctions at all scales and all levels of ‘meaningfulness’ (Xia et al., 2014) in scene-like and texture-like images. Each small point is one image; larger points with error bars show mean ±2 SE. Points have been jittered to aid visibility. (B) Correlations between number of junctions of each type with critical scale estimates for that image from the main experiment. Grey line shows linear model fit with shaded region showing 95% confidence area. Pearson correlation coefficient shown below. Note that the x-axis scales in the subplots differ. (C) Same as A but for junctions defined with a more strict ‘meaningfulness’ cutoff of (Xia et al., 2014). (D) Same as B for more ‘meaningful’ junctions as in C.

