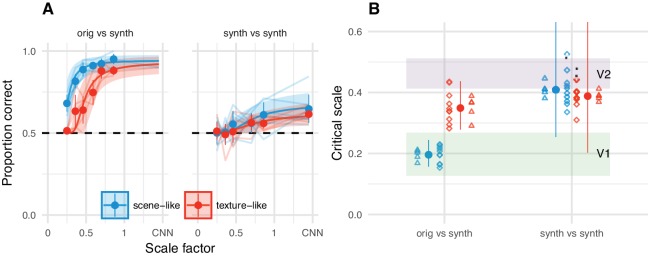
Appendix 1—figure 4. Results from the main paper replicated under an ABX task.
(A) Performance in the ABX task as a function of scale factor. Points show grand mean ±2 SE over participants; faint lines link individual participant performance levels. Solid curves and shaded regions show the fit of a nonlinear mixed-effects model estimating the critical scale and gain. (B) When comparing original and synthesised images, estimated critical scales (scale at which performance rises above chance) are lower for scene-like than for texture-like images. Points with error bars show population mean and 95% credible intervals. Triangles show posterior means for participants; diamonds show posterior means for images. Black squares show critical scale estimates of the four participants from Freeman and Simoncelli reproduced from that paper (x-position jittered to reduce overplotting); shaded regions denote the receptive field scaling of V1 and V2 estimated by Freeman and Simoncelli.

