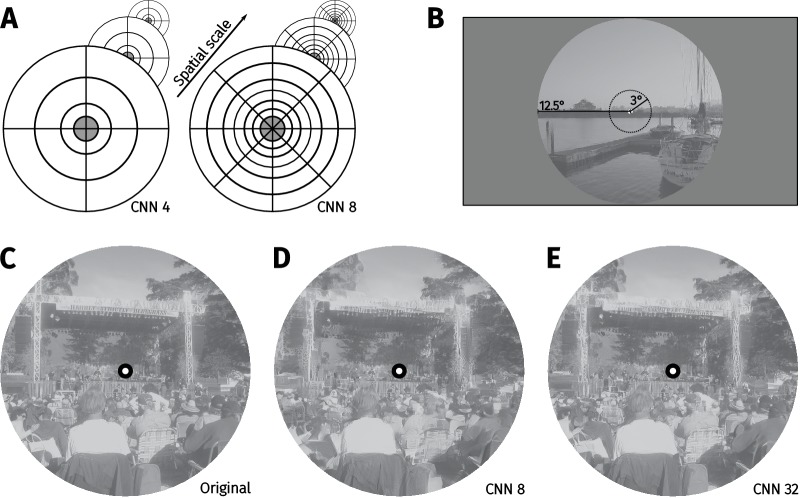
Appendix 2—figure 1. Methods for the CNN scene appearance model.
(A) The average activations in a subset of CNN feature maps were computed over non-overlapping radial and angular pooling regions that increase in area away from the image centre (not to scale), for three spatial scales. Increasing the number of pooling regions (CNN 4 and CNN 8 shown in this example) increases the fidelity of matching to the original image, restricting the range over which distortions can occur. Higher-layer CNN receptive fields overlap the pooling regions, ensuring smooth transitions between regions. The central 3° of the image (grey fill) is fixed to be the original. (B) The image radius subtended 12.5°. (C) An original image from the MIT1003 dataset. (D) Synthesised image matched to the image from C by the CNN 8 pooling model. (E) Synthesised image matched to the image from E by the CNN 32 pooling model. Fixating the central bullseye, it should be apparent that the CNN 32 model preserves more information than the CNN 8 model, but that the periphery is nevertheless significantly distorted relative to the original. Images from the MIT 1003 dataset (Judd et al., 2009), (https://people.csail.mit.edu/tjudd/WherePeopleLook/index.html) and reproduced under a CC-BY license (https://creativecommons.org/licenses/by/3.0/) with changes as described in the Materials and methods.

