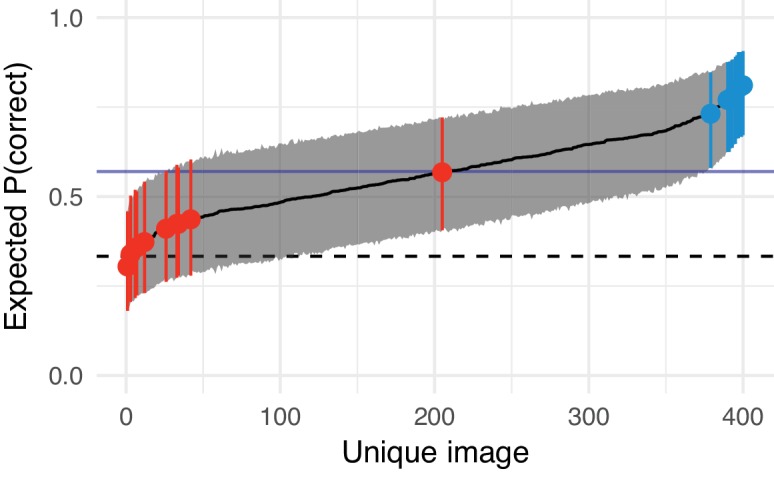
Appendix 2—figure 7. Estimated difficulty of each image in Experiment 3 (syntheses with the CNN 8 model) and the images chosen to form the texture- and scene-like categories in the main experiment.

Solid black line links model estimates of each image’s difficulty (the posterior mean of the image-specific model intercept, plotted on the performance scale). Shaded region shows 95% credible intervals. Dashed horizontal line shows chance performance; solid blue horizontal line shows mean performance. Red and blue points denote the images chosen as texture- and scene-like images in the main experiment respectively. The red point near the middle of the range is the ‘graffiti’ image from the experiments above.
