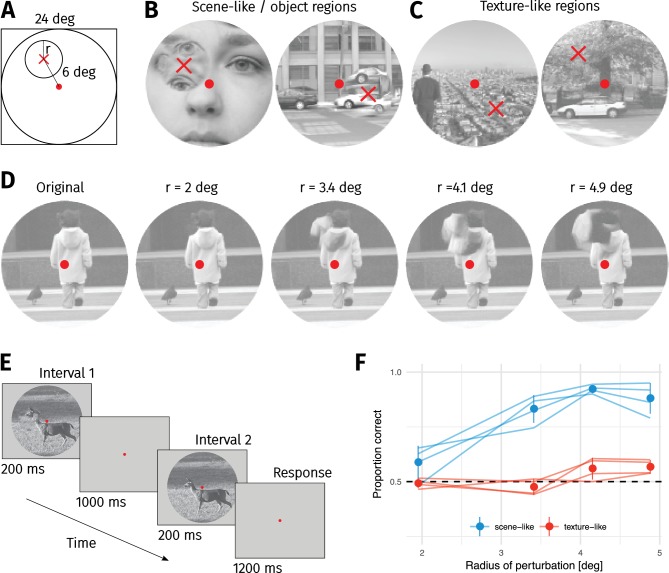
Figure 3. Sensitivity to local texture distortions depends on image content.
(A) A circular patch of an image was replaced with a texture-like distortion. In different experimental conditions the radius of the patch was varied. (B) Two example images in which a ’scene-like’ or inhomogenous region is distorted (red cross). (C) Two example images in which a ’texture-like’ or homogenous region is distorted (red cross). (D) Examples of an original image and the four distortion sizes used in the experiment. Images in B–D reproduced from the MIT 1003 Database (Judd et al., 2009), https://people.csail.mit.edu/tjudd/WherePeopleLook/index.html) under a CC-BY license (https://creativecommons.org/licenses/by/3.0/) with changes as described in the Methods. (E) Depiction of the 2IFC task, in which the observer reported whether the first or second image contained the distortion. (F) Proportion correct as a function of distortion radius in scene-like (blue) and texture-like (red) image regions. Lines link the performance of each observer (each point based on a median of 51.5 trials; min 31, max 62). Points show mean of observer means, error bars show SEM.

