. 2019 Apr 30;8:e45079. doi: 10.7554/eLife.45079

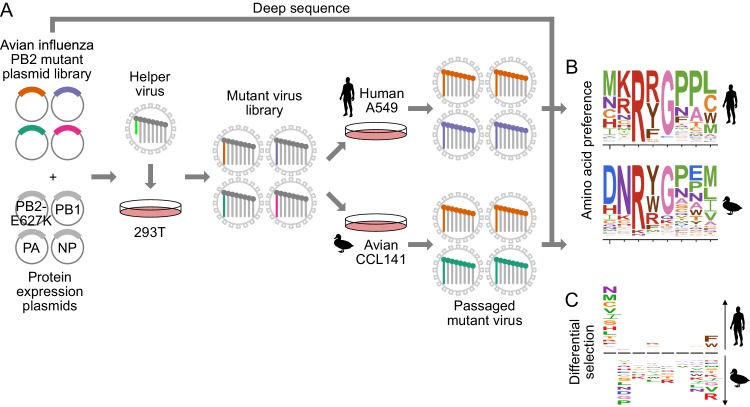
Figure 1. Deep mutational scanning of avian influenza PB2 in human and avian cells.

(A) We mutagenized all codons of PB2 from an avian influenza strain. We generated mutant virus libraries using a helper-virus approach, and passaged libraries at low MOI in human (A549) or duck (CCL-141) cells to select for functional PB2 variants. (B) We deep sequenced PB2 mutants from the initial mutant plasmid library and the mutant virus library after passage through each cell type. We computed the ‘preference’ for each amino acid in each cell type by comparing the frequency of each mutation before and after selection. In the logo plots, the height of each letter is proportional to the preference for that amino acid at that site. (C) To identify mutations that are adaptive in one cell type versus the other, we computed the differential selection by comparing the frequency of each amino-acid mutation in human versus avian cells. Letter heights are proportional to the log enrichment of the mutation in human versus avian cells. Figure 1—figure supplement 1 shows the phylogenetic relation of the chosen avian influenza strain to other influenza strains. Figure 1—figure supplement 2 shows further details of deep mutation scanning experiment. Figure 1—figure supplement 3 shows relative amplification of full-length PB2 versus PB2-GFP and PB2-deletion gene segments.

Figure 1.

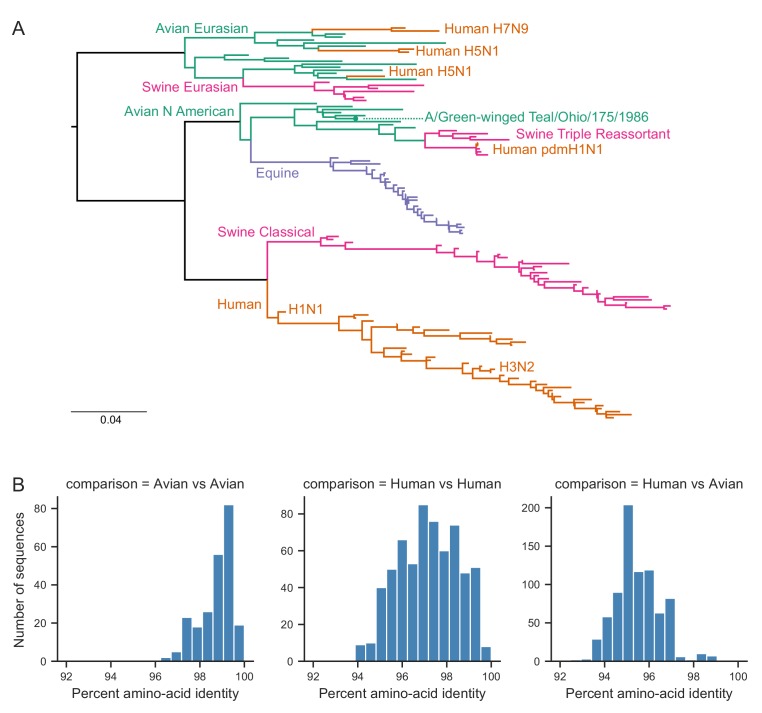
Figure 1—figure supplement 1. Phylogenetic relationship of PB2 sequence of chosen avian influenza strain to other influenza strains.

Figure 1—figure supplement 1.

(A) Phylogenetic tree of influenza PB2. We used PB2 sequences from the following influenza strains: A/Green-winged Teal/Ohio/175/1986 (indicated with a green dot), diverse strains sampled across years and hosts (Doud et al., 2015), and representatives of lineage-defining strains (human H3N2, human pandemic H1N1) and recent sporadic human cases of avian influenza strains (H5N1, H7N9). PB2 nucleotide sequences (of the coding sequence) were aligned using MAFFT and the phylogenetic tree was built using RAxML using the GTRCAT substitution model. Scale bar: mean nucleotide substitutions per site. (B) Pairwise amino-acid identity between all PB2 sequences shown in the tree, between just avian strains, between just human strains, and between human and avian strains.
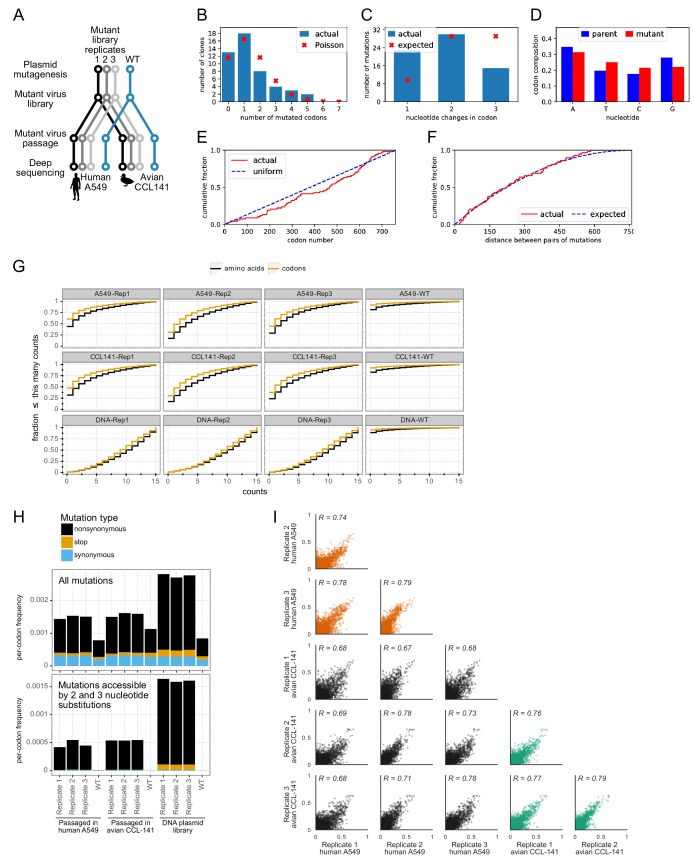
Figure 1—figure supplement 2. Details of deep mutational scanning experiment.

Figure 1—figure supplement 2.

(A) Experiments were performed in biological triplicate, starting from plasmid mutagenesis. All experimental steps were also performed on a wild-type PB2 gene (blue) to estimate error rates during deep sequencing and other experimental steps. (B—F) We picked 48 clones across the three replicate mutant plasmid libraries for Sanger sequencing. (B) There was an average of 1.4 codon mutants per clone, with the number of mutations per clone roughly following a Poisson distribution. (C) Distribution of number of nucleotide changes for each codon mutation. (D) Nucleotide frequencies in the mutant versus parent codons. (E) Mutations were distributed uniformly across the PB2 gene. (F) Cumulative distribution of pairwise distance between pairs of codon mutations, for clones with multiple mutations. The observed distribution is close to the expected distribution of pairs of mutations occurred independently. (G) Cumulative distribution of the fraction of mutations that are found less than or equal to the indicated number of times. ‘DNA’ refers to the mutant plasmid library. (H) Per codon frequencies of nonsynonymous, stop, and synonymous mutations for each mutant library replicate and wild type, measured either in the DNA plasmid library or after passaging in human (A549) or avian (CCL-141) cells. The top plot shows all mutations; the bottom plot shows only mutations accessible by 2 and 3 nucleotide substitutions. (I) Correlations among experimental replicates of all amino-acid preferences. Correlations compare replicates passaged in human cells (orange), avian cells (green), and between the two cell types (black).
Figure 1—figure supplement 3. Relative amplification of full-length PB2 versus PB2-GFP and PB2-deletion gene segments.
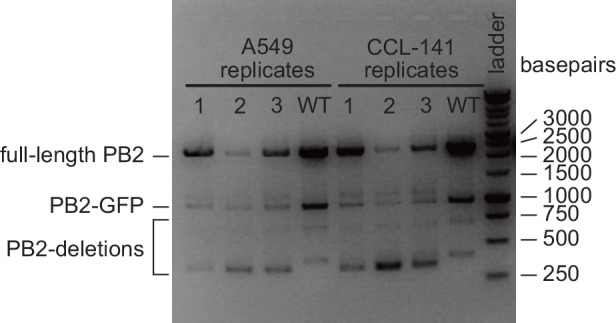
Figure 1—figure supplement 3.

Following passaging of PB2 mutant virus libraries and RNA extraction, PB2 vRNA was reversed transcribed then amplified using primers annealing to the ends of the vRNA. The PCR products were separated by gel electrophoresis. Bands likely corresponding to full length PB2, PB2-GFP, and PB2-deletion gene segments are labeled. The PB2-GFP comes from residual helper virus (which packages GFP in the PB2 segment) that was not purged by the low MOI passage, while internal deletions in PB2 are well known to arise spontaneously when virus is passaged in cell culture (Xue et al., 2016).