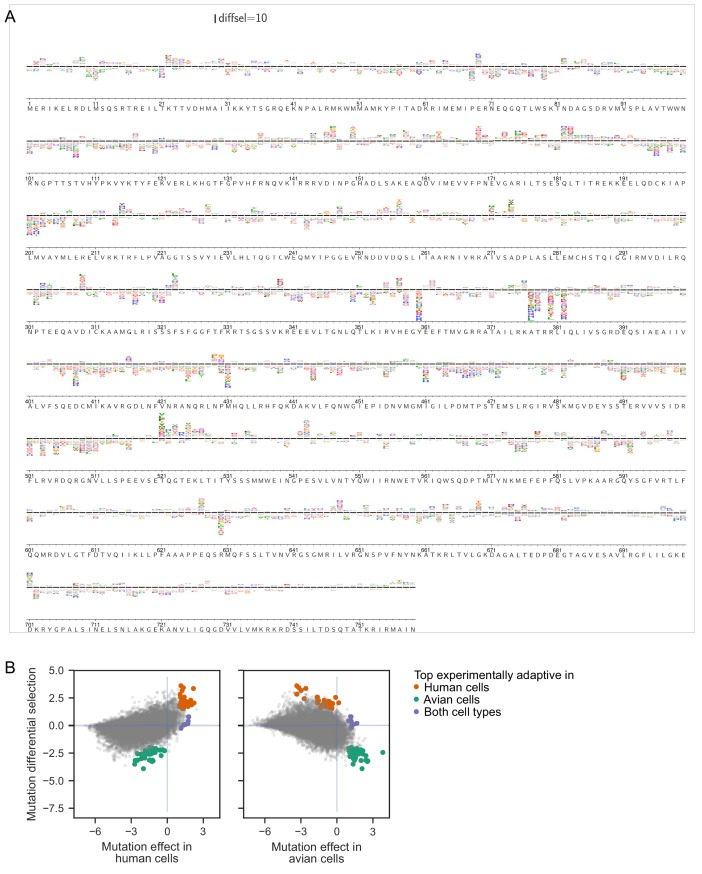
Figure 3. Deep mutational scanning identifies known and novel host-adaptive mutations.
(A) Distribution of experimentally measured differential selection for previously characterized human adaptive mutations and all other possible mutations to PB2. Positive differential selection means a mutation is favored in human versus avian cells. (B) Scatterplot of each mutation’s effect in human versus avian cells, showing the top adaptive mutations identified in the deep mutational scanning. (C) Logoplots showing the differential selection at the sites of mutations that we chose for functional validation. The height of each letter above the line indicates how strongly it was selected in human versus avian cells. Top adaptive mutations are colored in orange (human-adaptive) or green (avian-adaptive). Mutations chosen for functional validation are indicated by an asterisk(*). Additional mutations chosen for validation are colored light orange (differentially selected in human) or light green (differentially selected in bird). Mutations observed in H7N9 avian-to-human transmission are indicated by #. Note that not all mutations with high differential selection in human versus avian cells are classified as top adaptive mutations because we also filtered for mutations that are substantially beneficial relative to wildtype. (D) Logoplots showing amino acid preferences at sites we chose for functional validation. Top mutations beneficial in both human and avian cells are colored purple. Mutations chosen for validation are indicated by *. Figure 3—figure supplement 1 shows the complete map of differential selection in human versus avian cells. Catalog of previously described human/mammalian adaptive mutations are in Figure 3—source data 1.


