. 2019 Apr 30;8:e45079. doi: 10.7554/eLife.45079

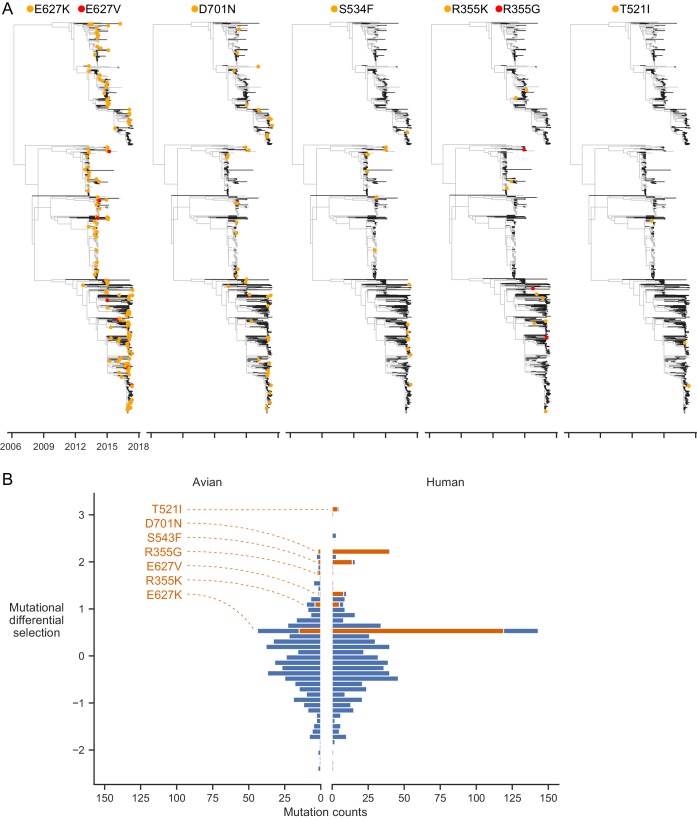
Figure 6. Experimentally identified human-adaptive mutations are enriched in avian-human transmission of H7N9 influenza.

(A) Phylogeny of H7N9 influenza PB2 sequences. Branches in human and avian hosts are colored black and gray respectively. Orange or red dots indicate where a mutation was inferred to have occurred. Branch lengths are scaled by annotated and inferred dates of origin of each sequence. (B) Distribution of experimentally measured differential selection values for all mutations occurring during H7N9 evolution in human and avian hosts. A positive differential selection value means that our experiments measured the mutation to be beneficial in human versus avian cells. A subset of top differentially selected mutations that occur frequently are labeled and plotted in orange. Enlarged phylogenetic trees are in Figure 6—figure supplement 15. Counts of mutations identified in phylogenetic analysis are in Figure 6—source data 1. Mutations plotted in each bin of the histogram are in Figure 6—source data 2.

Figure 6—source data 1. H7N9 human and avian mutation counts.
DOI: 10.7554/eLife.45079.024
Figure 6—source data 2. H7N9 human and avian mutation differential selection values and counts in each histogram bin.
DOI: 10.7554/eLife.45079.025

Figure 6.

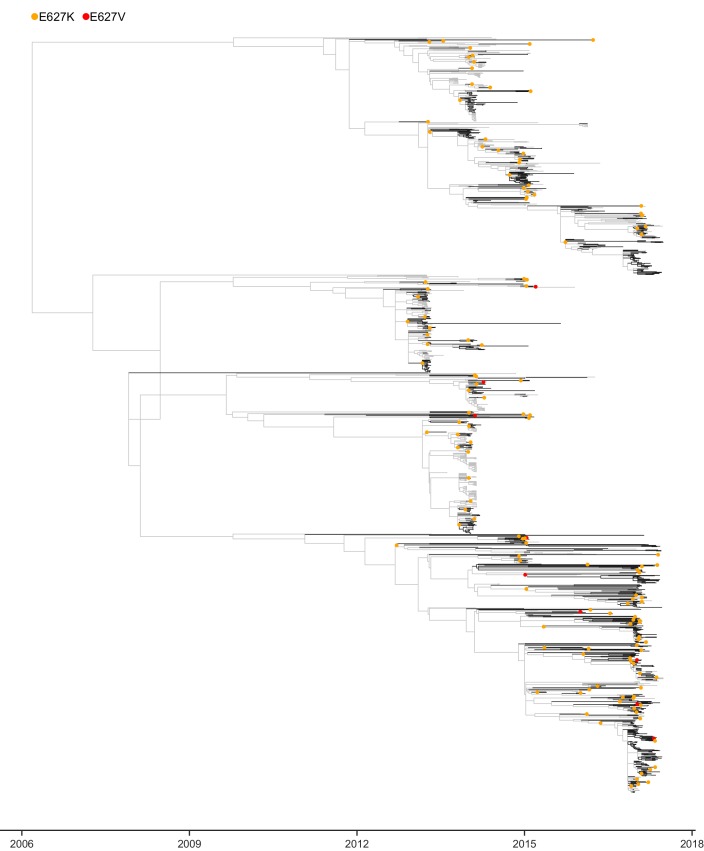
Figure 6—figure supplement 1. Phylogeny of H7N9 influenza PB2 sequences showing where mutations at site 627 were inferred to have occurred.

Figure 6—figure supplement 1.

Branches in human and avian hosts are colored black and gray respectively. Orange or red dots indicate where a mutation was inferred to have occurred. Branch lengths are scaled by annotated and inferred dates of origin of each sequence.
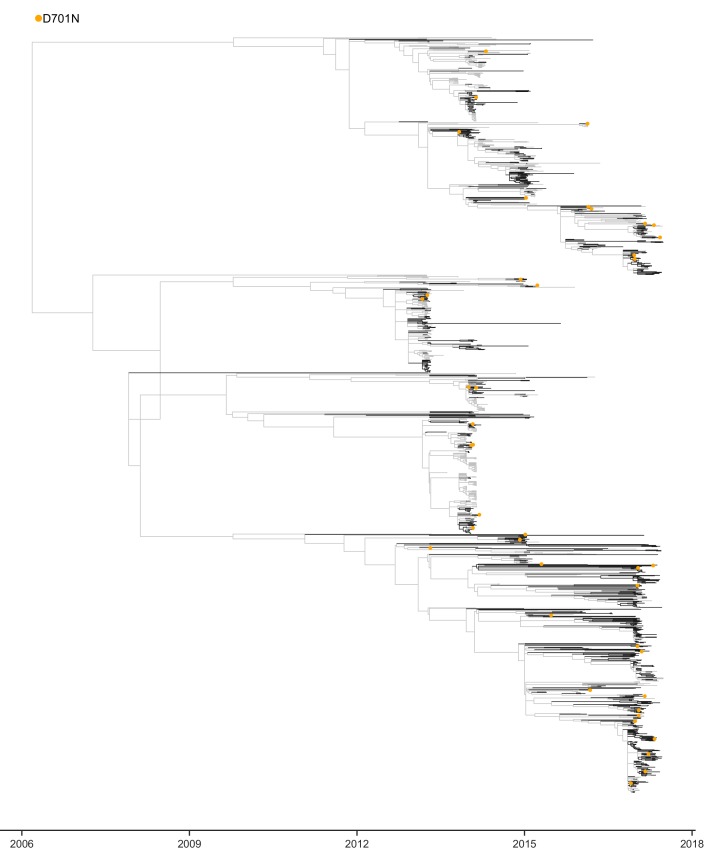
Figure 6—figure supplement 2. Phylogeny of H7N9 influenza PB2 sequences showing where mutations at site 701 were inferred to have occurred.

Figure 6—figure supplement 2.

Branches in human and avian hosts are colored black and gray respectively. Orange dots indicate where a mutation was inferred to have occurred. Branch lengths are scaled by annotated and inferred dates of origin of each sequence.
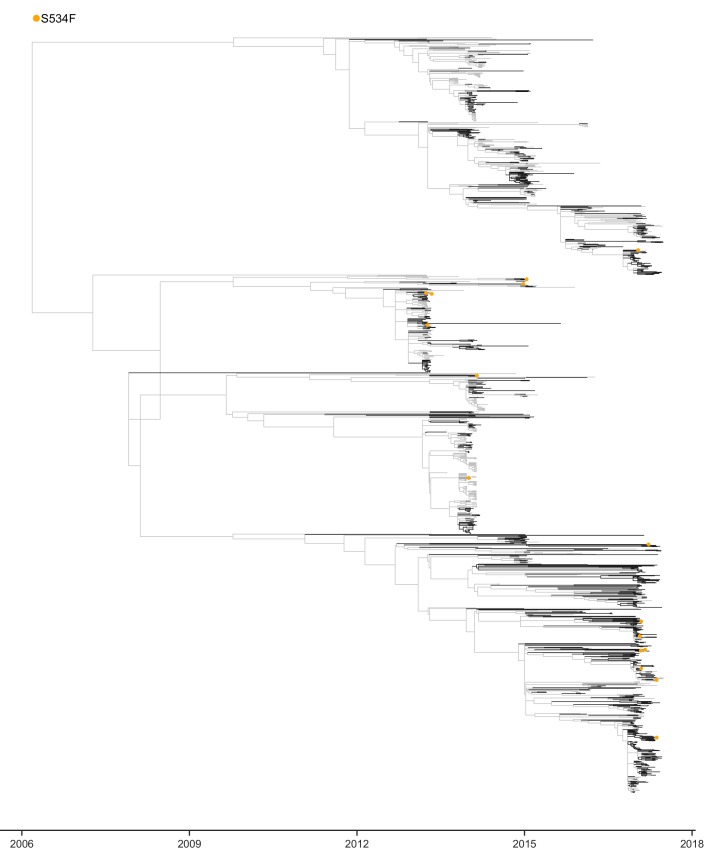
Figure 6—figure supplement 3. Phylogeny of H7N9 influenza PB2 sequences showing where mutations at site 534 were inferred to have occurred.

Figure 6—figure supplement 3.

Branches in human and avian hosts are colored black and gray respectively. Orange dots indicate where a mutation was inferred to have occurred. Branch lengths are scaled by annotated and inferred dates of origin of each sequence.
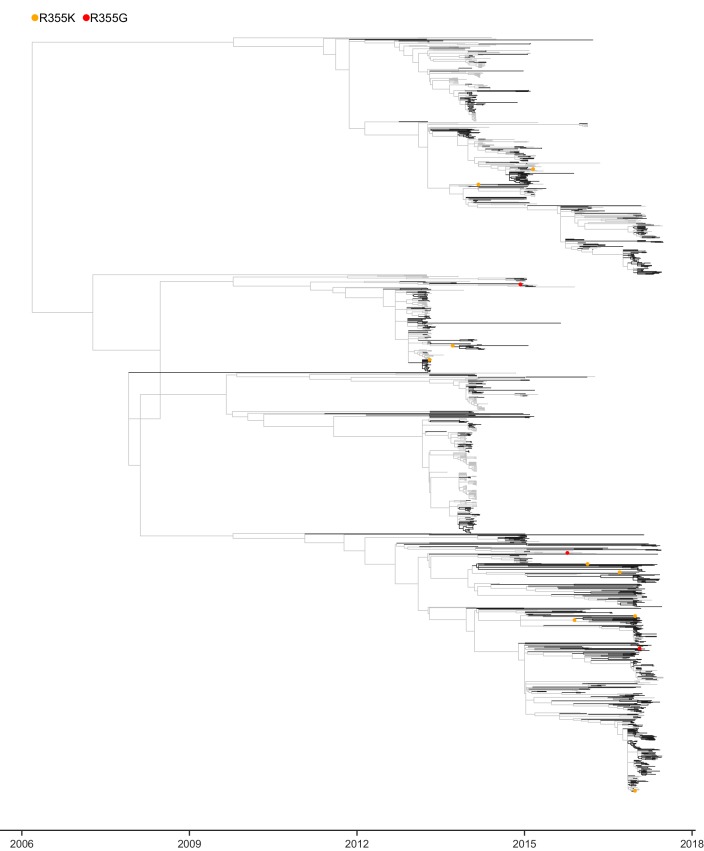
Figure 6—figure supplement 4. Phylogeny of H7N9 influenza PB2 sequences showing where mutations at site 355 were inferred to have occurred.

Figure 6—figure supplement 4.

Branches in human and avian hosts are colored black and gray respectively. Orange or red dots indicate where a mutation was inferred to have occurred. Branch lengths are scaled by annotated and inferred dates of origin of each sequence.
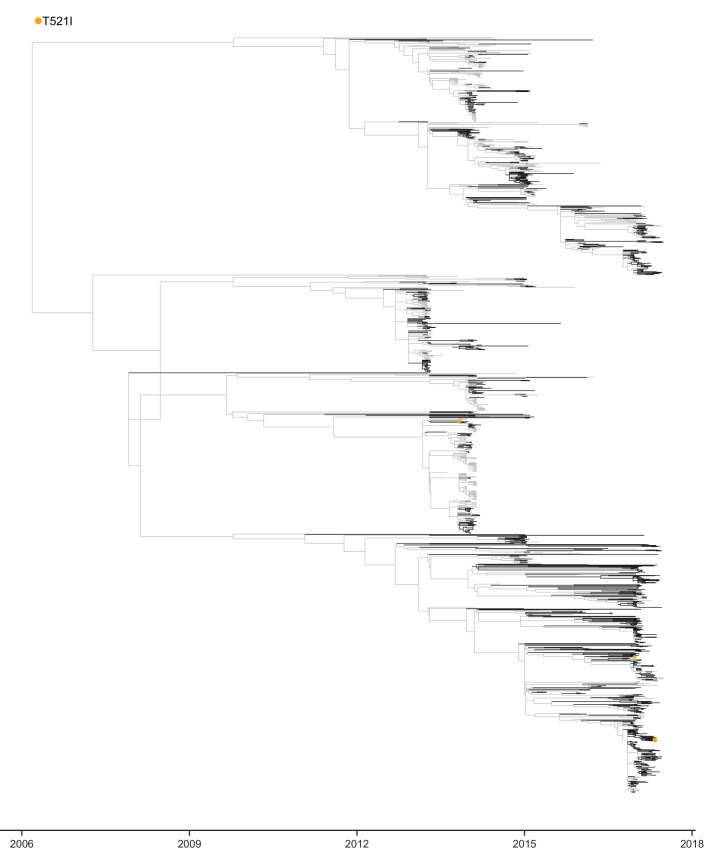
Figure 6—figure supplement 5. Phylogeny of H7N9 influenza PB2 sequences showing where mutations at site 521 were inferred to have occurred.

Figure 6—figure supplement 5.

Branches in human and avian hosts are colored black and gray respectively. Orange dots indicate where a mutation was inferred to have occurred. Branch lengths are scaled by annotated and inferred dates of origin of each sequence.