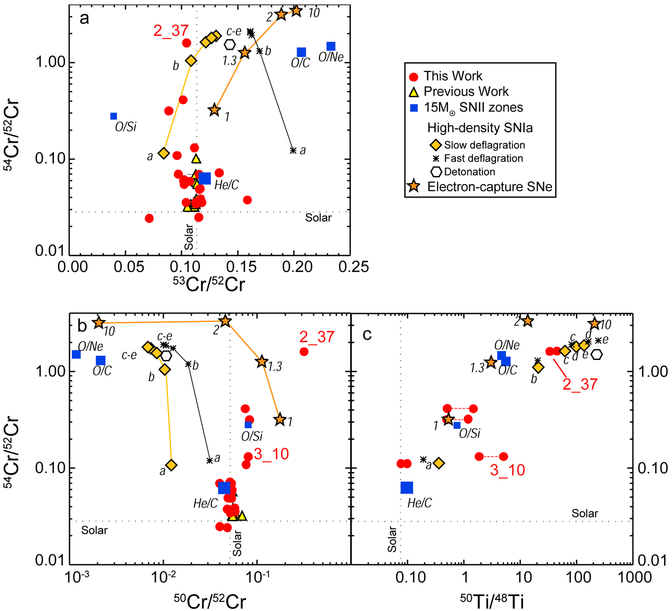
Figure 4.
Chromium and Ti isotopic ratios of anomalous grains (circles and triangles) compared with predictions of supernova models. Two 50Ti/48Ti ratios are calculated for each anomalous grain (see text and Table 1), connected by red-dotted lines. Type II supernova predictions (squares) are for the 15 M⊙ model of Woosley & Heger (2007) with zones labeled according to the most abundant isotopes; the symbol sizes are proportional to the total mass of Cr contained in each zone. High-density Type Ia supernovae predictions (diamonds, asterisks and hexagons) from Woosley (1997); letters refer to the initial central density in units of 109 g/cm3: a: 2.0, b: 4.0, c: 5.8, d: 7.4, e: 8.2. Electron-capture supernova predictions (stars) were calculated from Figure 5 of Wanajo et al. (2013a); the numbers indicate the assumed density, relative to the default model (≡1).

