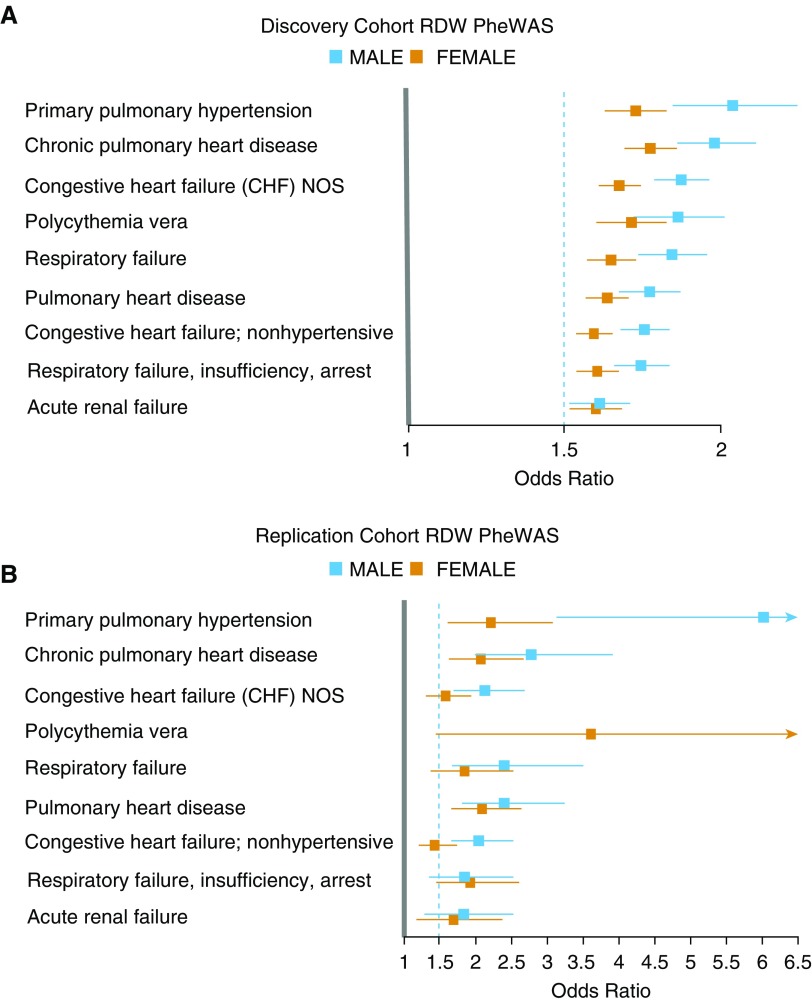
Figure 2.
Top phenotypes associated with red cell distribution width (RDW) by phenome-wide association study (PheWAS) analyses. (A) PheWAS results for RDW in the discovery cohort stratified by sex. All displayed phenotypes from the discovery cohort had a lower 95% confidence interval above 1.5. (B) PheWAS results for RDW from the replication cohort, limited to the phenotypes identified in the discovery cohort. Mean odds ratios and 95% confidence intervals are shown. NOS = not otherwise specified.

