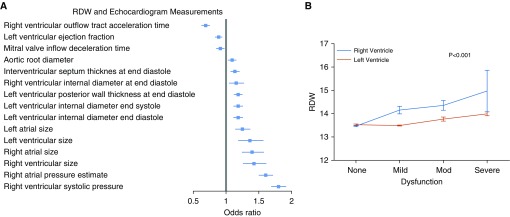
Figure 3.
The association of red cell distribution width (RDW) with multiple parameters of cardiac structure and function by echocardiography. (A) for each variable, the boxes represent the odds ratio comparing 25th versus 75th percentile of RDW. Horizontal lines represent 95% confidence intervals. Analyses performed by ordinal regression adjusting for age at echocardiogram, sex, and self-declared race. (B) Mean RDW by degree of ventricular dysfunction. P value calculated by two-way analysis of variance. Vertical bars represent standard error of the mean.

