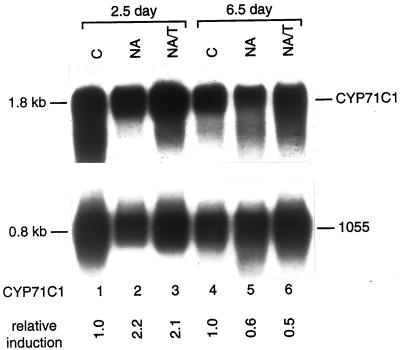
Figure 6.
Induction of CYP71C1 in response to NA and NA/T treatments. One microgram of poly(A)+ mRNA isolated from control (C), NA-, or NA/T-treated 2.5- or 6.5-d-old seedlings were electrophoresed on 1.2% (v/v) agarose-formaldehyde gels, transferred to Hybond-N nylon membrane, and probed at high stringency with the full-length EST sequence of the CYP71C1 cDNA and subsequently with the constitutive maize 1055 cDNA (Sachs, 1991). CYP71C1 mRNA levels were quantified by phosphorimager analysis and normalized relative to the 1055 mRNA levels. The relative induction levels for CYP71C1 mRNA after each treatment compared with the CYP71C1 mRNA in control seedlings of the same age are shown below each lane.

