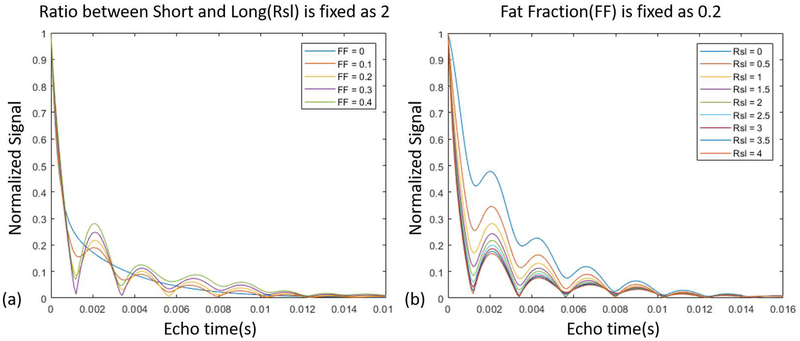
Figure 1.
Signal simulation based on a tri-component model (without noise). (a) shows how the signal changes for different fat fractions (FF), while the ratio between the short T2* (bound water) and long T2* (pore water) components (RSL) is fixed as 2. (b) shows how the signal changes for different RSL values, while FF is fixed as 0.2.

