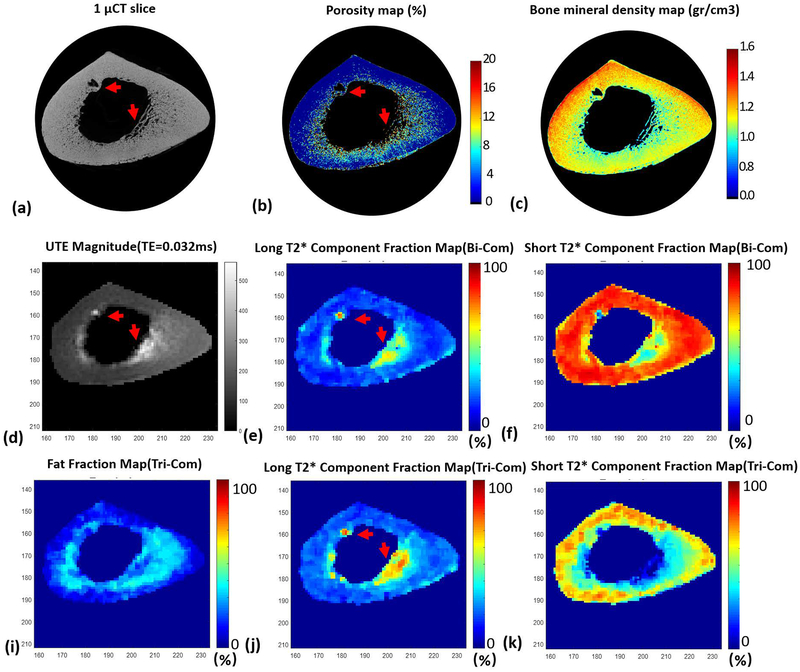
Figure 2.
Typical mapping results for one bone specimen (73-year-old male). (a) is the μCT image. (b) and (c) are the porosity maps and BMD maps obtained from the μCT results. (d) is the magnitude of the corresponding UTE image with echo time of 0.032ms. (e) and (f) are the short and long T2* component fraction maps obtained from bi-component fitting analysis. (i), (j), and (k) are fat, short, and long T2* component fraction maps obtained from tri-component fitting analysis. Red arrows in (a) and (b) indicate pores in bone, while arrows in (d), (e), and(j) indicate residual PBS in the pores, which resulted in high MRI signal, as well as high fraction of long T2* component.

