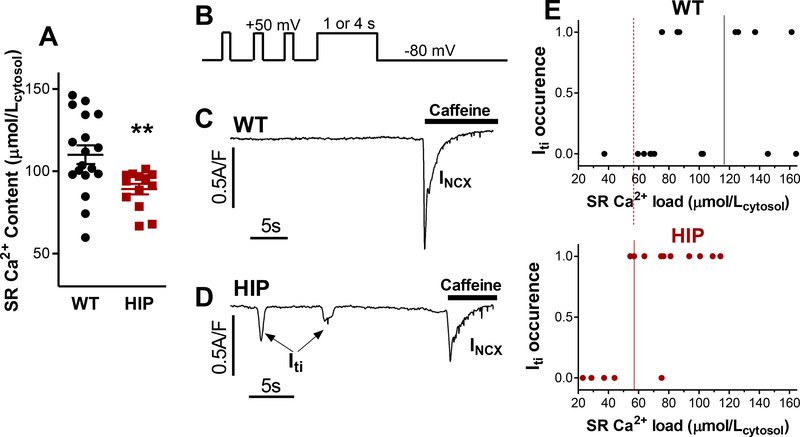
Figure 2. Reduced threshold SR Ca2+ for Iti occurrence in myocytes from HIP vs. WT rats.
(A) Steady-state SR Ca2+ content in myocytes from HIP and WT rats assessed from the amplitude of caffeine-induced Ca2+ transient. (B) Voltage protocol used for measuring the Iti threshold. Myocytes were conditioned by applying 100 ms depolarization pulses from −80 to +50 mV for 2 min (only last 3 are shown). Then, cells were depolarized to +50mV for 1 or 4 seconds, to drive Ca2+ into the cell via reverse-mode NCX, thus increasing the SR Ca2+ content. Iti was measured on repolarization to −80 mV (for 30 s). (C-D) Examples of current recordings following repolarization in a WT (C) and a HIP (D) myocyte. Caffeine was applied at the end to release all Ca2+ from the SR. The ensuing inward current is carried mainly by NCX (INCX). The sum of Iti and INCX integrals indicates the SR Ca2+ load. (E) Threshold SR Ca2+ load for Iti occurrence in HIP and WT myocytes.

