
4.
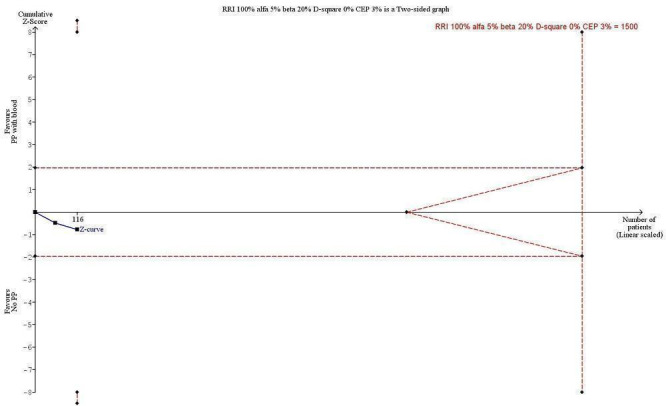
Trial Sequential Analysis (TSA) of the meta‐analysis of 2 trials reporting all‐cause mortality at the maximal length of follow‐up. The blue line is the cumulative Z‐curve, and the boundaries for benefit and harm are shown in the upper and lower panels as a line between two points. The futility boundaries are shown as an inner wedge to the right side as a triangle with the base adhering to the vertical line demonstrating the required information size. The control event proportion (CEP) is 3%, and we are addressing an alternative hypothesis that pulmonary artery perfusion with oxygenated blood may double mortality to 6% within maximal length of follow‐up, with maximal type I and II errors of 5% and 20%, respectively. The required information size based on actual diversity of trials of 0% is 1500 participants, and none of the TSA boundaries is crossed. The TSA adjusted confidence interval (CI) is 0.01 to 493. The traditional 95% CI is 0.43 to 6.91.