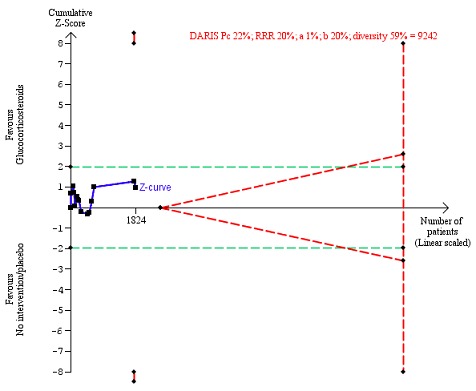
Figure 6.

All‐cause mortality at the end of treatment (median 28 days (range 3 days to 12 weeks) (post hoc analysis). Fourteen trials provided data. The diversity‐adjusted required information size (DARIS) was calculated based on all‐cause mortality of 22% in the control group; risk ratio reduction in the glucocorticosteroid group of 20%; type I error of 1%; and type II error of 20% (80% power). Trial diversity was 59%. The required information size was 9242 participants. The cumulative Z‐curve (blue line) did not cross the trial sequential monitoring boundaries for benefit or harm (red inward sloping lines) and did not enter the trial sequential monitoring area for futility (inner‐wedge with red outward sloping lines). The green dotted lines show the conventional boundaries of the naive alpha of 5% equal to Z‐scores of +1.96 and ‐1.96.
