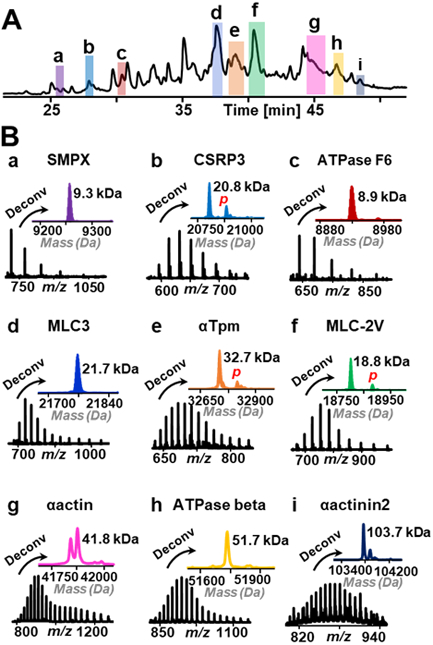
Figure 2.

A TIC of proteins extracted from swine heart tissue separated by C8@BTSEY column. B Top-down mass spectra and deconvoluted mass spectra of selected proteins with different masses. Italic “p” in red refers to phosphorylation. In panel g, the two peaks in the deconvoluted mass spectrum of αactin are two different isoforms, alpha cardiac actin (41813.82 Da) and alpha skeletal actin (41845.77 Da).
