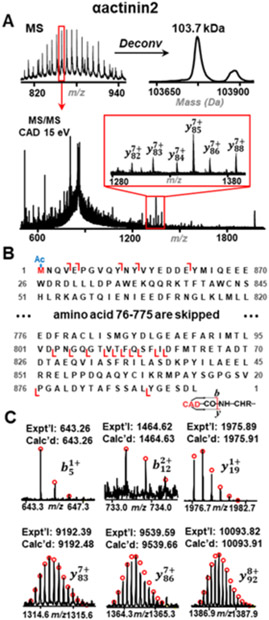
Figure 3.

A Mass spectra, deconvoluted mass spectra and MS/MS mass spectra of αactinin2 (F1RHL9_PIG, UniProtKB). Precursor ion at 858 m/z was isolated and fragmented by CAD. Insets, zoomed-in view of the representative fragment ions. B Protein sequence map of αactinin2. N-terminal acetylation is highlighted in red. C Representative b and y ions of αactinin2 from CAD fragmentation.
