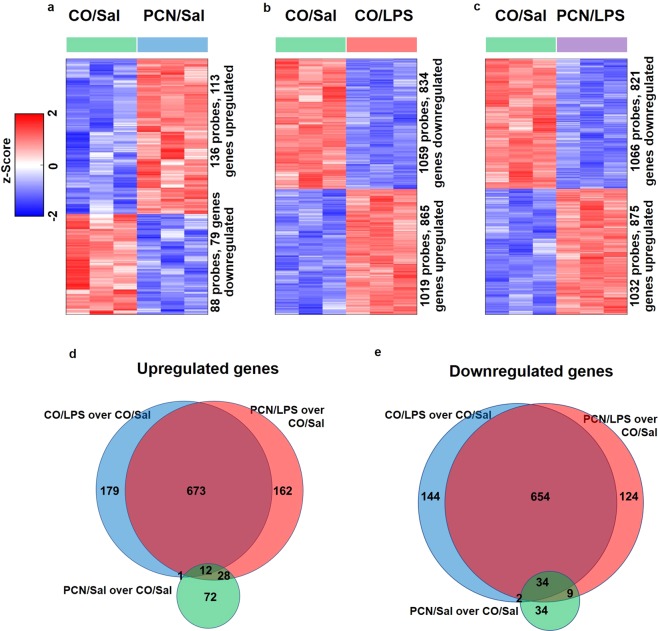
Figure 2.
PCN and LPS treatments lead to robust yet distinct transcriptomic changes. Heatmaps of the differentially expressed genes (DEGs) with (a) exclusive PCN treatment, (b) exclusive LPS treatment and (c) combined PCN/LPS treatment are shown. (d–e) The number of upregulated and downregulated DEGs by PCN treatment, LPS treatment and combined PCN/LPS treatment compared to those in the control are shown. The genes were considered to be differentially expressed with a p-value < 0.05 and a fold change greater than or equal to 1.25-fold or less than or equal to 0.8-fold. Heatmaps were generated using mean-centered normalized expression values (z-scores), employing the Euclidean distance metric, the average clustering method and R statistical software.

