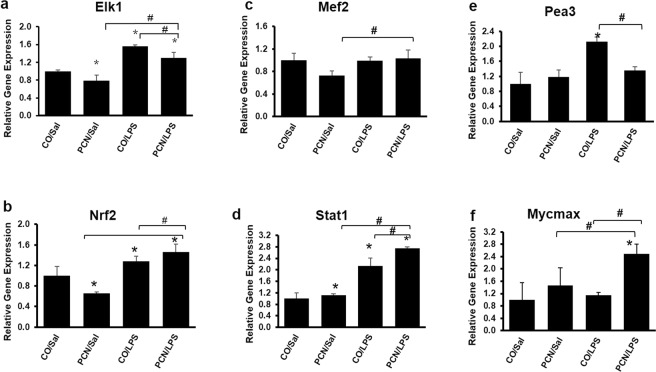
Figure 6.
Real-time qPCR analysis for the validation of gene expression of the following transcription factors: (a) Elk1, (b) Nrf2, (c) Mef2 (d) Stat1, (e) Pea3, and (f) Mycmax. The mice were treated with corn oil or PCN (50 mg/kg/day) for 3 days followed by saline or LPS (2 mg/kg) for 16 h. A few select candidate genes from the list of transcription factors that were differentially regulated between the PCN and LPS treatments were chosen for the validation of gene expression. *p < 0.05 compared to the control treatment. #p < 0.05 compared to PCN or LPS treatment alone.

