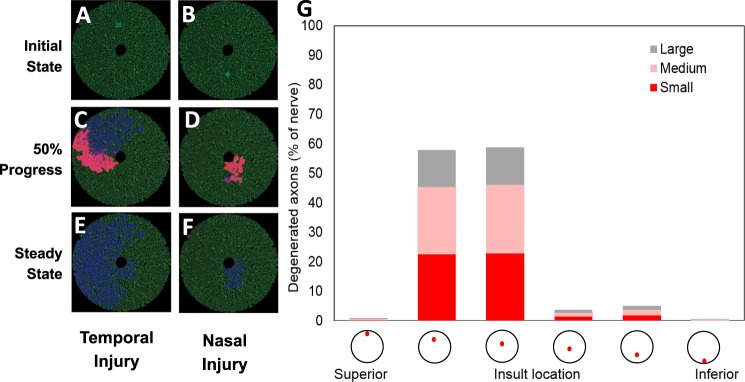
Figure 3.
Sensitivity analysis on superoxide injury location varying along the superior-inferior axis. (A) Schematic of the optic nerve with a superior injury at the initial state (time = 0). (B) Simulation at 50% completion. (C) Simulation at 100% completion (at steady state). (D) Schematic of the optic nerve with an inferior injury at the initial state (time = 0). (E) Simulation at 50% completion. (F) Simulation at 100% completion (at steady state). (G) Steady-state axonal size distribution.

