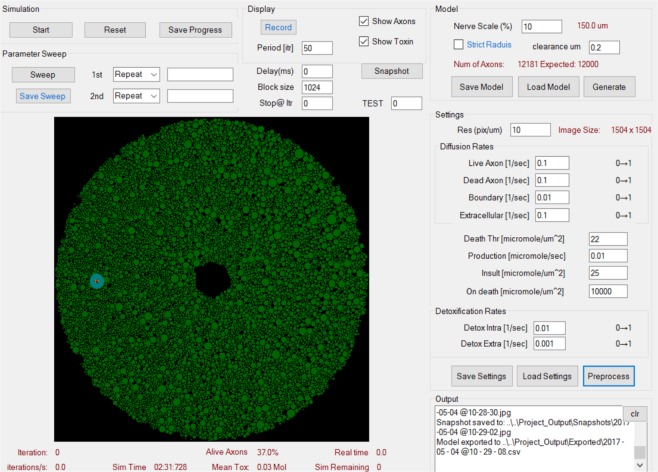
Figure 8.
Simulation Initialization and Graphical Output. Control panel for the optic nerve modelling parameters (top right section: “Model”) and superoxide diffusion parameters (middle right section: “Diffusion and Scavenging rates”). The platform allows recording a simulation as well as taking snapshots at different time intervals. It also displays the number of iterations performed, the proportion of alive axons, total amount of superoxide in moles as well as the elapsed simulation time. A schematic of the initial state for optic nerve axons is depicted in green.

