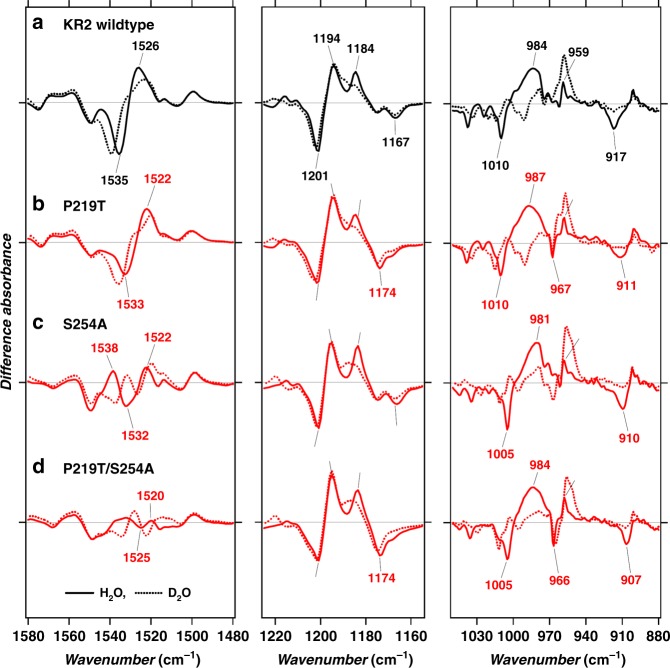
Fig. 4.
Light-induced infrared absorption changes of the KR2 mutants. Light-induced Fourier transform infrared difference spectra of a KR2 wildtype (black) and the mutants (red), b P219T, c S254A and d P219T/S254A, in the 1580–1480 (left), 1225–1155 (middle) and 1050–880 cm−1 (right) regions at T = 77 K and pH 8.0. Solid and dotted lines represent the samples hydrated with H2O and D2O, respectively. Source data are provided as a Source Data file

