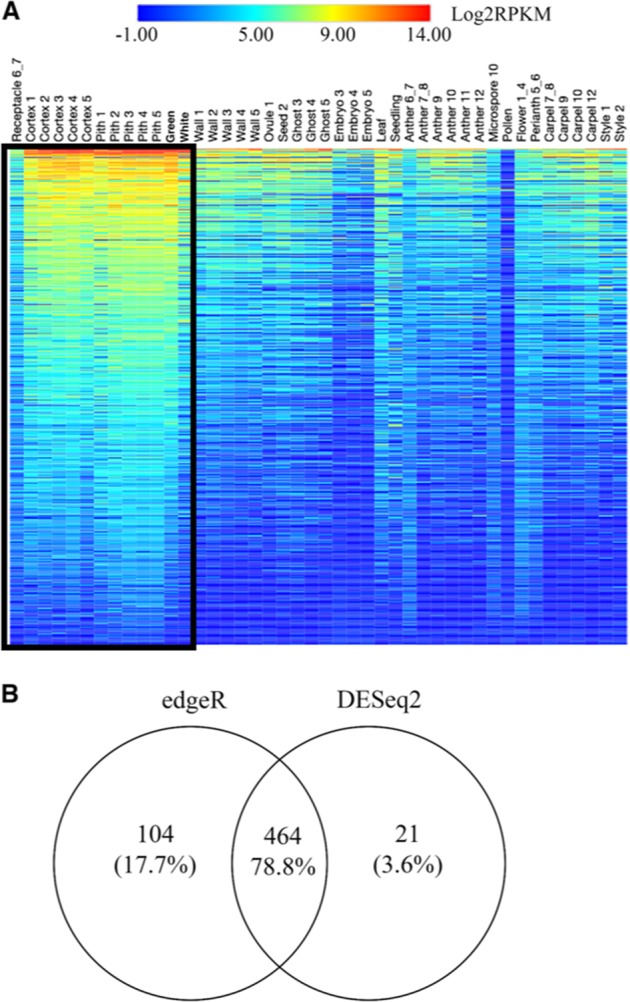
Fig. 1. Differential expression analyses identified 589 receptacle preferentially expressed (RP) genes.

a Heatmap showing expression profiles of 589 RP genes across all profiled tissues and stages of development (see Table S1 for description of each tissue). Each row represents one gene and each column represents a specific tissue. Receptacle tissues are outlined by the black box. Warmer colors denote higher expression. Log2 transformed reads per kilobase million (RPKM) values were used as input to generate the heatmap. RPKM values from the two biological replicates of each library were averaged. b Venn diagram indicating numbers of differentially expressed genes identified by the edgeR and DESeq2 packages
