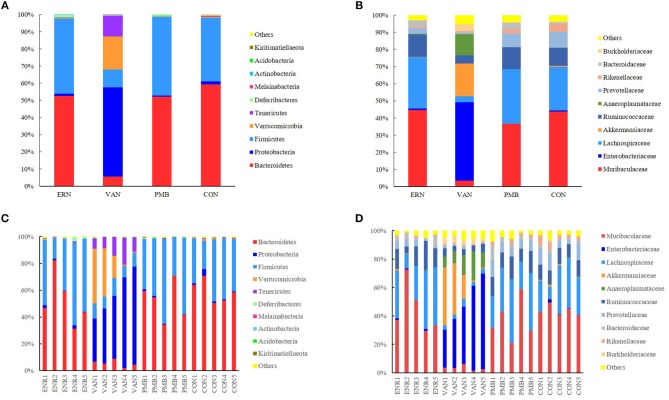
Figure 5.
Taxonomic plots showing relative abundance across the different groups after 3 weeks treatment. (A) The average phylum-level taxonomic composition in each group. (B) The average family-level taxonomic composition in each group. (C) The phylum-level taxonomic composition in each mouse. (D) The family-level taxonomic composition in each mouse. ENR, enrofloxacin; VAN, vancomycin; PMB, polymixin B sulfate; CON, control group.

