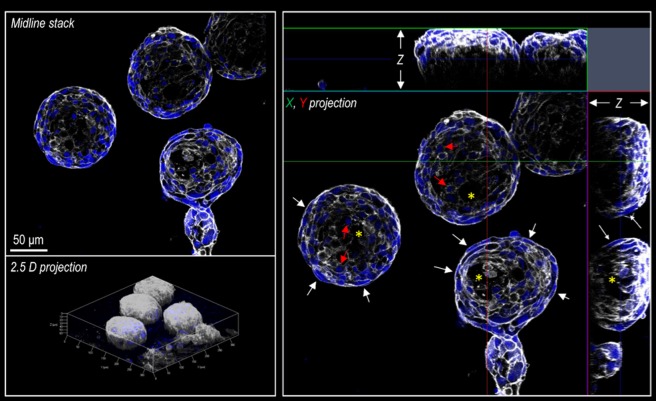
Figure 1.
Structure of the cardiospheres as observed by confocal microscopy. White color represents the cytoskeleton as evidenced by F-actin staining with Phalloidin. Blue color represents the nuclei as revealed by DAPI, an intercalant of the DNA. The three panels represent the midline stack (upper left) the 2.5 projection of the cardiospheres with the X and Y dimensions (lower left) and the projection of the whole stack along the indicated X and Y axes (right) respectively.

