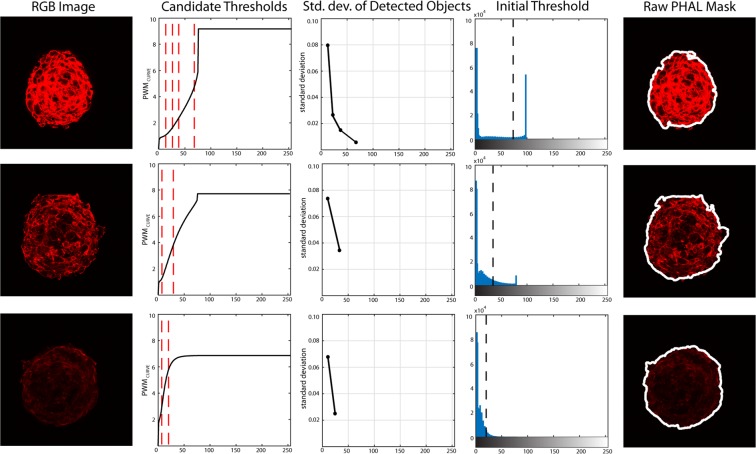
Figure 5.
Processing for obtaining the initial threshold for different images of the stack with different high variation of intensity (PHAL layer). Starting from the red layer of the RGB image, the PWMCURVE is estimated from its grayscale histogram. Then, candidate thresholds are evaluated as inflection points of the curve (red dotted lines). The standard deviation of detected objects intensity using candidate thresholds is calculated and the initial threshold is determined as the one with the lowest standard deviation. In the last column, the application of the initial threshold on the RGB image is shown.

