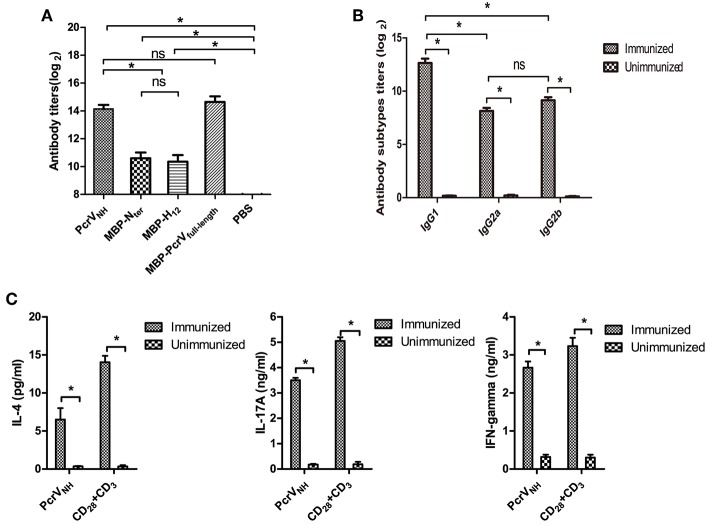
Figure 3.
Analysis of PcrVNH-elicited immune responses. (A) PcrVNH-elicited humoral immune response. The bar represents the titer of IgG against PcrVNH, MBP-Nter, MBP-H12, and MBP-PcrVfull−length from PcrVNH-immunized mice (B). The subtypes of anti-PcrVNH antibodies. The bar represents the titer of IgG1, IgG2a, and IgG2b against PcrVNH 7 days after the last immunization. (C) PcrVNH-elicited cellular immune response in the spleen. Splenocytes from PcrVNH-immunized mice were collected and stimulated with purified antigens. The bar represents the concentration of IL-4, IFN-γ, and IL-17A in the culture supernatant. The data are shown as the mean ± SE. Multiple comparisons among three groups were analyzed by one-way ANOVA. *P < 0.05, ns, no significance (P > 0.05).

