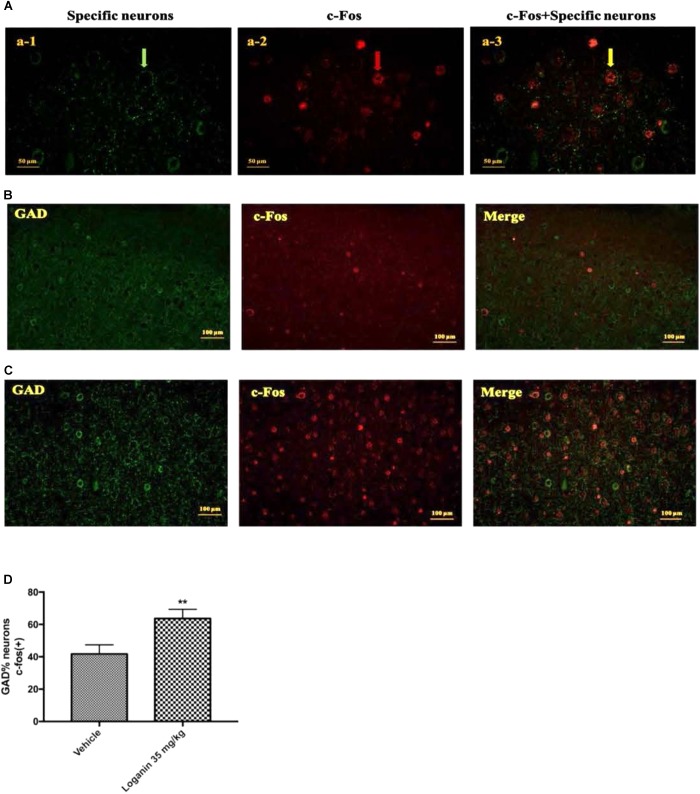
FIGURE 9.
The effect of Loganin on c-Fos expression in the VLPO. The GABAergic neurons were labeled by green, c-Fos was labeled by red. (A) An example of photomicrographs of the double-immunostained neurons (scale bar = 50 μm; original magnification 400×). Fluorescence micrographs of c-Fos and GAD in normal mice (B) and mice treated with loganin 35 mg/kg (C) (scale bar = 100 μm; original magnification 200×). (D) Quantification of the number of c-Fos positive GABAergic neurons. Data are represented as mean ± SEM (n = 5). ∗∗P < 0.01, vs. vehicle (unpaired Student’s t-test).

