FIGURE 1.
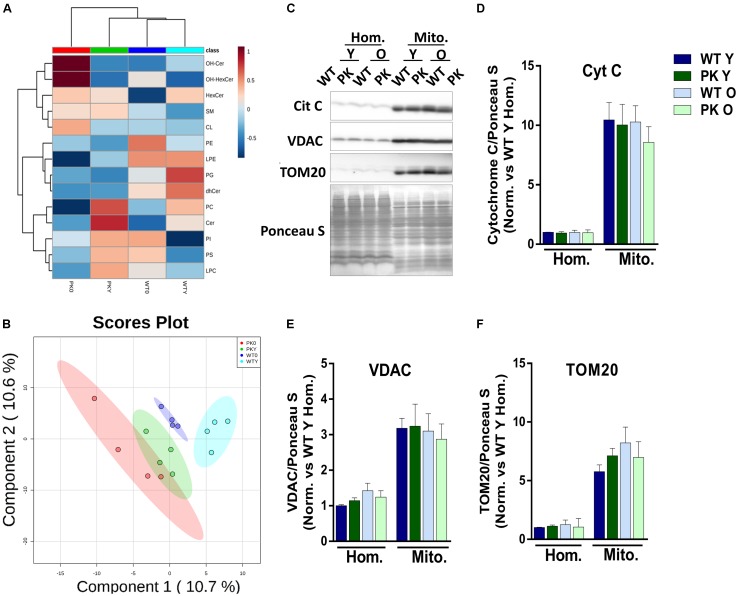
Lipidomic composition of brain’s mice mitochondria change due to aging and parkin loss. Lipidomic analysis and enrichment of mitochondrial fraction isolated from WT and PK-KO mice’s brain. (A) Heatmap of lipidomic classes detected and changes due to aging and parkin loss expressing the relative differences between the groups after normalization and the hierarchical clustering. (B) 2D representation of the Partial Least Square Discriminant Analysis of brain’s mitochondrial lipidomic composition. (C) Western-Blot experiments showing homogenates and mitochondria stained for Cytochrome C, VDAC, and TOM20. (D) Quantification of Cyt C signal intensity in homogenates and mitochondria. (E) Quantification of VDAC signal intensity in homogenates and mitochondria. (F) Quantification of TOM20 signal intensity in homogenates and mitochondria. n = 4–6 for western blot analysis. Graphs represent the mean ± SEM. Panels A,B were made using MetaboAnalyst software. Statistical analysis of western blot experiments was done by One Way ANOVA test. OH Cer, hydroxylated ceramide; OH HexCer, hydroxylated hexosylceramide; HexCer, hexosylceramide; SM, sphingomyelin; CL, cardiolipin; PE, phosphatidylethanolamine; LPE, lysophosphatidylethanolamine; PG, phosphatidylglycerol; dhCer, dihydroceramide; PC, phosphatidylcholine; Cer, ceramide; PI, phosphatiylinositol; PS, phosphatidylserine; LPC, lysphosphatidylcholine; Hom, homogenate; Mito, mitochondria; Cyt C, cytochrome C; Y, young; O, old.

